Brand health tracking solution
May 18, 2023
For VND38,250,000 (US$1,500) per month, you can monitor your brand and learn how your hard work
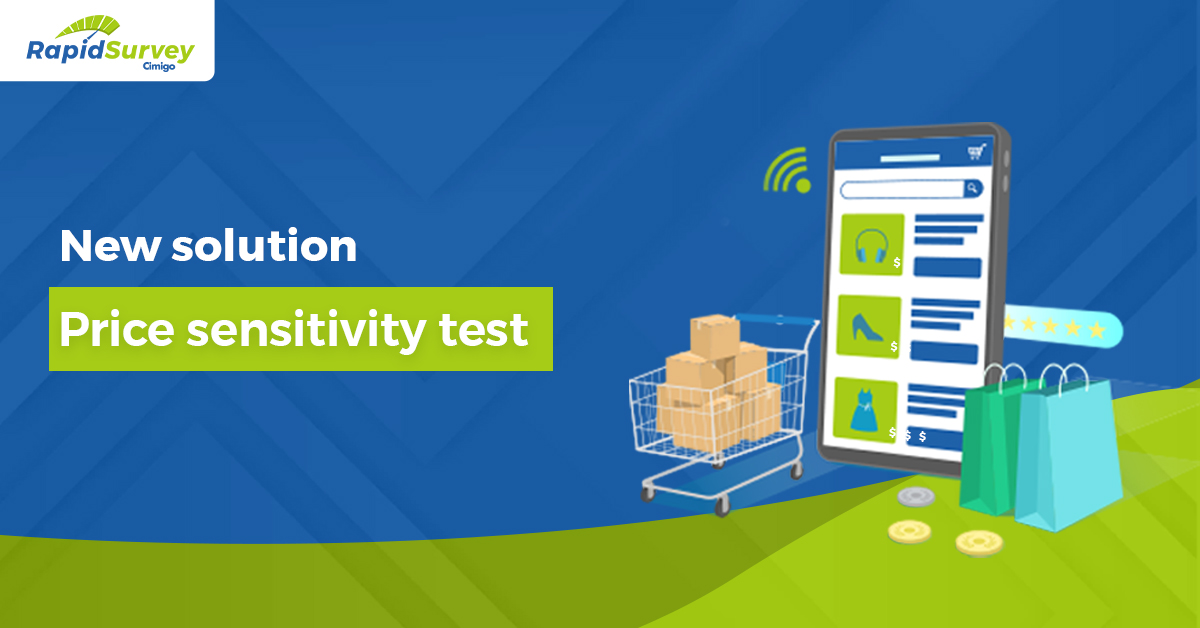
Pricing is a critical element in any business strategy. Set it too high, and you risk alienating potential customers; set it too low, and you may undermine your profitability. Striking the right balance is a challenging task that can make or break a company’s success. One powerful tool that businesses can leverage to determine optimal pricing is the Price Sensitivity Meter (PSM).
Whether you are evaluating a service or product price change or launching a new service or product, you can quickly make the best price point. Cimigo price sensitivity test determines the acceptable price range and the optimal price for your brand.
Developed by Dutch economist Peter van Westendorp in the 1970s, it is a widely respected method for gauging consumer price sensitivity. Cimigo applies this simple price sensitivity meter to determine the acceptable price range and the optimal price for a particular product or service. Start using our price sensitivity solution by clicking here.
In the price sensitivity survey, consumers are asked at which price the brand being tested is:
In this example, the optimal price is 38,500 ₫. The acceptable range is from 29,723 ₫ to 49,080 ₫. Beyond this range, too much demand is lost.

The graph consists of four lines, with each representing one of the four main questions. The x-axis shows the price points, while the y-axis shows the proportion of respondents who chose each price point.
When these lines intersect, four pricing points are formed as below:
Optimal price point: Intersection of “too cheap” and “too expensive” lines, where customers feel that is the best price for them and they are most willing to buy.
Expected price point: Intersection of “cheap” and “expensive” lines, where customers expect that the price should be.
Low price point: Intersection of “too cheap” and “expensive” lines, where the product is perceived to lack quality relative to the price.
High price point: Intersection of “cheap” and “too expensive” lines, where the price outweighs the benefit.
The range between the low price and the high price is the acceptable price range.
If you have questions, please do contact Cimigo at ask@cimigo.com for support.


Brand health tracking solution
May 18, 2023
For VND38,250,000 (US$1,500) per month, you can monitor your brand and learn how your hard work

Brand health check solution
Nov 14, 2024
For VND63,724,500 (US$2,499), you can measure and diagnose your brand’s health amongst 300
Unlocking pricing insights with a price sensitivity meter
Oct 12, 2023
Pricing is a critical element in any business strategy. Set it too high, and you risk alienating
Đoàn Ngọc Huy (Johnny Doan), CMO & Market Research Expert -
As a Marketing Director and Market Research Expert Advisor across international markets, I have collaborated with numerous market research agencies, both global and local, that operate with a high level of professionalism and effectiveness. Cimigo is among the most outstanding. The Cimigo team demonstrates exceptional professionalism, strong commitment, and operational excellence. From research design and fieldwork execution to insight analysis, all stages are conducted rigorously, delivered on schedule, and closely aligned with business objectives. This is a highly capable team that I would confidently recommend to my partners and stakeholders.
As a Marketing Director and Market Research Expert Advisor across international markets, I have collaborated with numerous market research agencies, both global and local, that operate with a high level of professionalism and effectiveness. Cimigo is among the most outstanding. The Cimigo team demonstrates exceptional professionalism, strong commitment, and operational excellence. From research design and fieldwork execution to insight analysis, all stages are conducted rigorously, delivered on schedule, and closely aligned with business objectives. This is a highly capable team that I would confidently recommend to my partners and stakeholders.

Lisa Nguyen - Vietnam Marketing Lead

Mark Ratcliff - Managing Director
The team at Cimigo are my favourite researchers in South East Asia. They’ve proved adept at tackling the most private and complex personal issues at qualitative research level, not flinching when the client endlessly chopped and changed fieldwork timing, or ramped up the workload without warning. They have recruited the most extraordinarily niche consumers without pause or complaint. Their patience with clients and their flexibility and hard work that went above and beyond what was initially asked of them on two projects relating to sexual behaviour means there is now no other research company we would choose to work with in that part of Asia. The fact they also pulled off a third project for us so well, on men’s relationship with beer and beer advertising, shows they have breadth of expertise— we still quote from the report they produced.
The team at Cimigo are my favourite researchers in South East Asia. They’ve proved adept at tackling the most private and complex personal issues at qualitative research level, not flinching when the client endlessly chopped and changed fieldwork timing, or ramped up the workload without warning. They have recruited the most extraordinarily niche consumers without pause or complaint. Their patience with clients and their flexibility and hard work that went above and beyond what was initially asked of them on two projects relating to sexual behaviour means there is now no other research company we would choose to work with in that part of Asia. The fact they also pulled off a third project for us so well, on men’s relationship with beer and beer advertising, shows they have breadth of expertise— we still quote from the report they produced.
Kevin McQuillan - Chief Marketing Officer
Sam Houston - Chief Executive Officer

Minh Thu - Consumer Market Insights Manager
Travis Mitchell - Executive Director
Malcolm Farmer - Managing Director
Hy Vu - Head of Research Department
Joe Nelson - New Zealand Consulate General
Steve Kretschmer - Executive Director
York Spencer - Global Marketing Director
Laura Baines - Programmes Snr Manager
Mai Trang - Brand Manager of Romano

Hanh Dang - Product Marketing Manager
Luan Nguyen - Market Research Team Leader
Max Lee - Project Manager
Chris Elkin - Founder
Ronald Reagan - Deputy Group Head After Sales & CS Operation
Chad Ovel - Partner

Private English Language Schools - Chief Executive Officer
Rick Reid - Creative Director

Anya Nipper - Project Coordination Director

Dr. Jean-Marcel Guillon - Chief Executive Officer
Joyce - Pricing Manager

Matt Thwaites - Commercial Director
Aashish Kapoor - Head of Marketing

Kelly Vo - Founder & Host
Thanyachat Auttanukune - Board of Management
Hamish Glendinning - Business Lead

Thuy Le - Consumer Insight Manager
Richard Willis - Director

Ha Dinh - Project Lead
Geert Heestermans - Marketing Director
Vo Thi Thuy Ha - Commercial Effectiveness

Louise Knox - Consumer Technical Insights

Aimee Shear - Senior Research Executive
Dennis Kurnia - Head of Consumer Insights
Tania Desela - Senior Product Manager
Thu Phung - CTI Manager
Linda Yeoh - CMI Manager

Cimigo’s market research team in Vietnam and Indonesia love to help you make better choices.

Cimigo provides market research solutions in Vietnam and Indonesia that will help you make better choices.

Cimigo provides a range of consumer marketing trends and market research on market sectors and consumer segments in Vietnam and Indonesia.

Cimigo provides a range of free market research reports on market sectors and consumer segments in Vietnam and Indonesia.