Brand health tracking solution
May 18, 2023
For VND38,250,000 (US$1,500) per month, you can monitor your brand and learn how your hard work
For VND38,250,000 (US$1,500) per month, you can monitor your brand and learn how your hard work impacts its performance. By managing what you can measure, you will save far more than the cost of brand monitoring.
Your results will be made available to you on an online dashboard and updated monthly with a rolling sample of 600 consumers over the past 3 months.
In order to manage your brand, you must measure its performance. You will learn what works and does not work in your brand marketing activities. For example, to understand the effectiveness of your marketing campaigns, messaging, channels and expenditure, you need to measure your brand’s performance.
Brand monitoring will enable data-driven decisions and make your marketing efforts far more cost-effective. You will save far more than the cost of brand monitoring by managing what you can measure.
Reasonable. Our fees are super low.
Reach. Rural, urban, region or key cities. You decide. It has no impact on the fees.
Rapid. Last month’s results are available on your dashboard. Always.
Responsive. No stopping required for holidays.
Reliable. Our quality control includes independent 3rd party quality monitoring.
Risk mitigation. No annual commitment is required. You may choose not to renew at any time.
Brand monitoring enables you to manage your brand’s performance in the market and the activities you undertake to support your brand. Whether you are expanding your brand’s presence in-store or raising awareness amongst consumers through marketing activities., you can manage better, knowing how your brand is performing.
The biggest consumer brands in the market conduct brand monitoring. Brand monitoring does not need to be cumbersome, overpriced and unresponsive. Cimigo makes agile, low-cost and responsive brand monitoring available to all brands. Cimigo’s brand health tracking monitor uses proprietary online panels and dashboards to deliver this agility.
Cimigo’s brand health tracking monitor will show you changes over time, including;
You can compare your brand to competitors and learn from competitive successes and failures. You may review your brand performance across different locations and demographic target groups (e.g., gender, age and economic class).
You can learn where your brand is strongest by location; rural, urban, region or key cities. You may review your brand performance across different demographic target groups (e.g. gender, age and economic class). You decide when you set up your study which locations and demographics to include. It has no impact on the fees.
Cimigo will kick off your brand monitor with 600 of your target consumers in the first month. Thereafter each month Cimigo will add 200 more, so you can always look at your brand’s performance on a rolling sample (that is, the last 600 interviews by the date conducted) during the past three months.
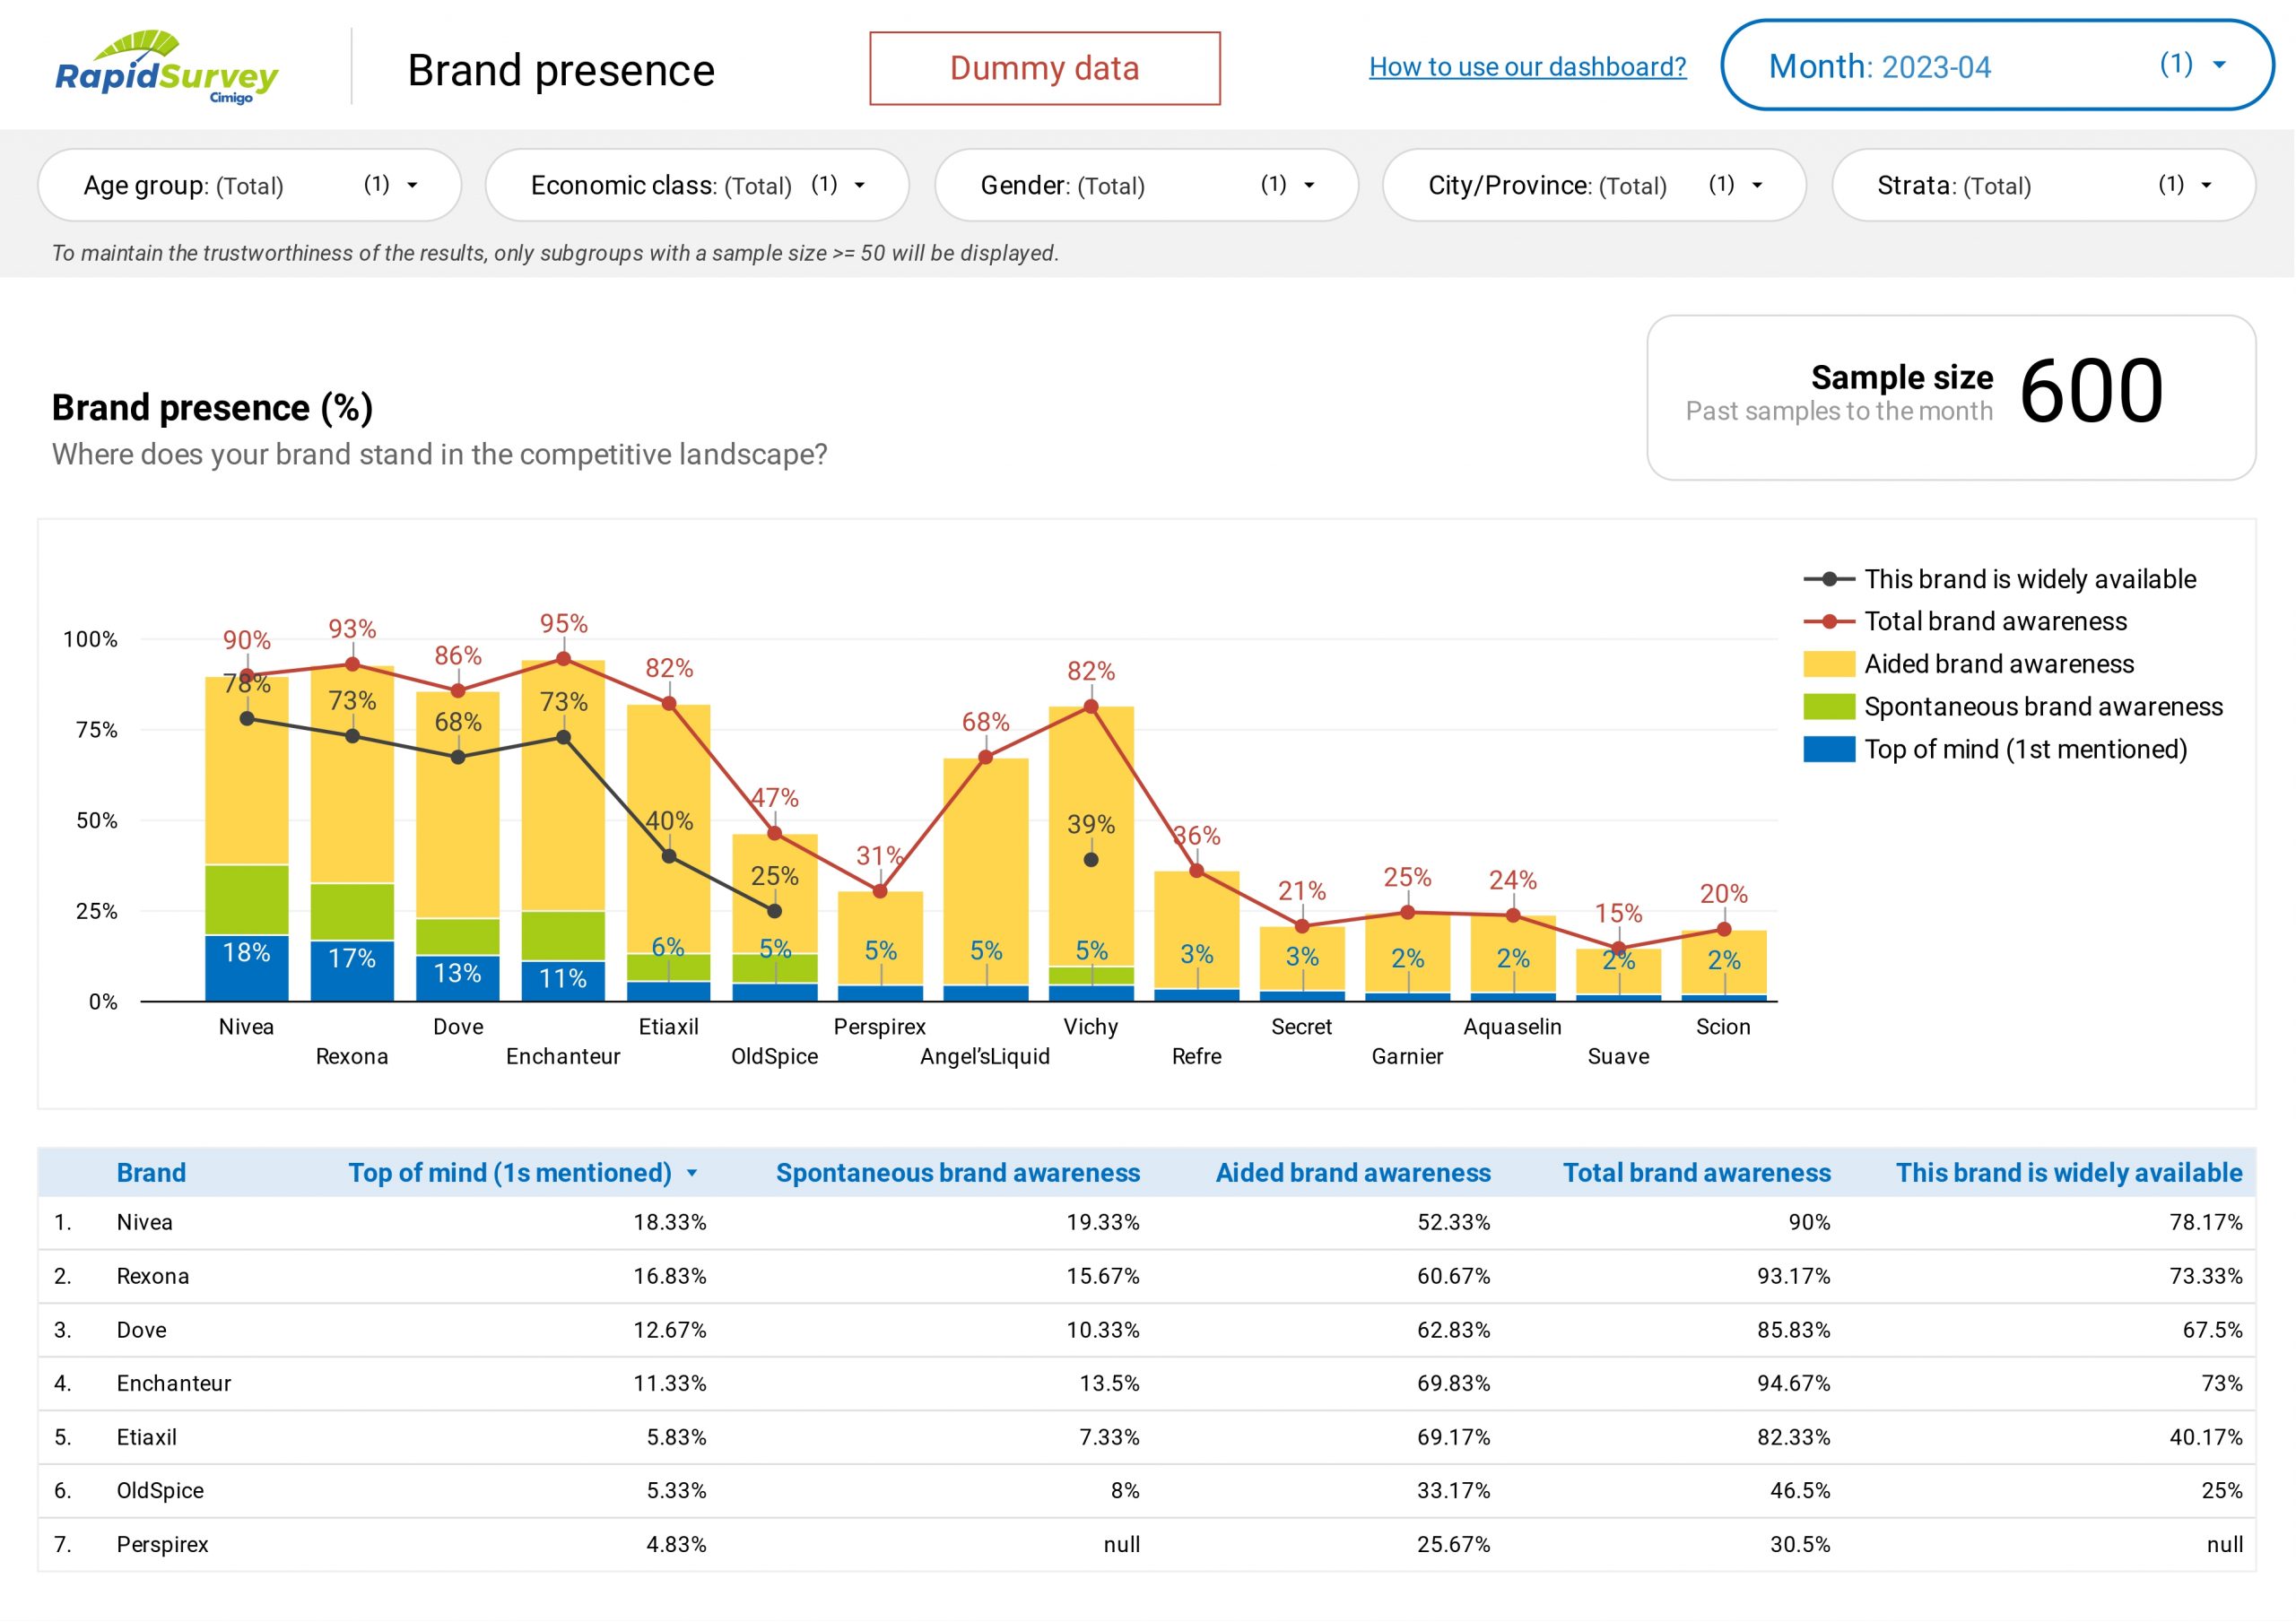
Over any period of time, you may select your brand (or a competitive brand) and review a performance summary which includes any or all of the key metrics below;
Building a presence in consumers’ memory requires physical availability at points of sale and through marketing communications. Empirical research from the Ehrenberg-Bass Institute, popularised in the book titled How Brands Grow, authored by Byron Sharp, highlights the importance of building a physical and mental presence.
Brands grow by increasing penetration, attracting incremental users, often very occasional brand users. Whether those brands are products or services, marketed by business-to-consumer or by business-to-business channels, the empirical data supports this premise.
Seeking to convert the regular users of brands holding a large market share is less effective. The larger brand’s presence (both its mental and physical availability) ensures it gains at least its fair share of sales plus its own continued growth if it continues to build a further presence.
The following metrics are included to help you manage brand presence and the degree of awareness and saliency being achieved.
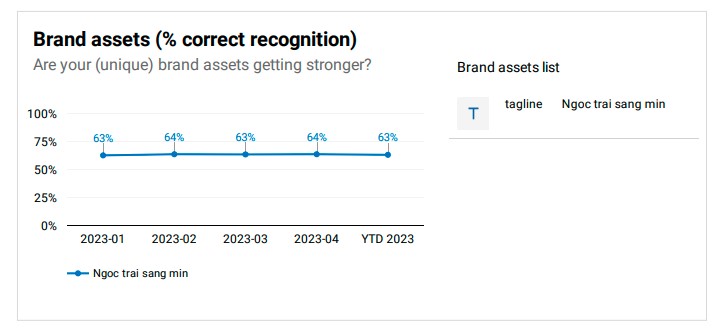
Prompting your brand in a consumer’s memory (i.e. prompting mental presence) is made easier when unique brand assets help anchor consumer memory constructs to your brand. For example, the Oreo cookie, the audio pitch of the Biore voice-over, the Coca-Cola bottle, the Dutch Lady image, the Nike swoosh and the McDonald’s “I’m Lovin’ It” jingle.
Unique brand assets hold great importance, where there is limited room for differentiation, e.g., bottled water. A unique brand asset (e.g. pack design) enables consumers to recall your brand readily, so they can then make a quick and easy decision to buy your familiar brand.
The metric used is the correct brand recognition when consumers see or hear the brand asset tested. This could be an image, a pack or a sound. Managing your brand assets will help build and maintain your brand’s presence and the saliency of awareness is achieved.
You will learn what works and does not work in your brand marketing activities. The metrics included below will enable you to understand how effective your marketing expenditure is, whether advertising is being recalled, and whether you are reaching more target consumers (i.e. what proportion of your target consumers are recalling your advertising).
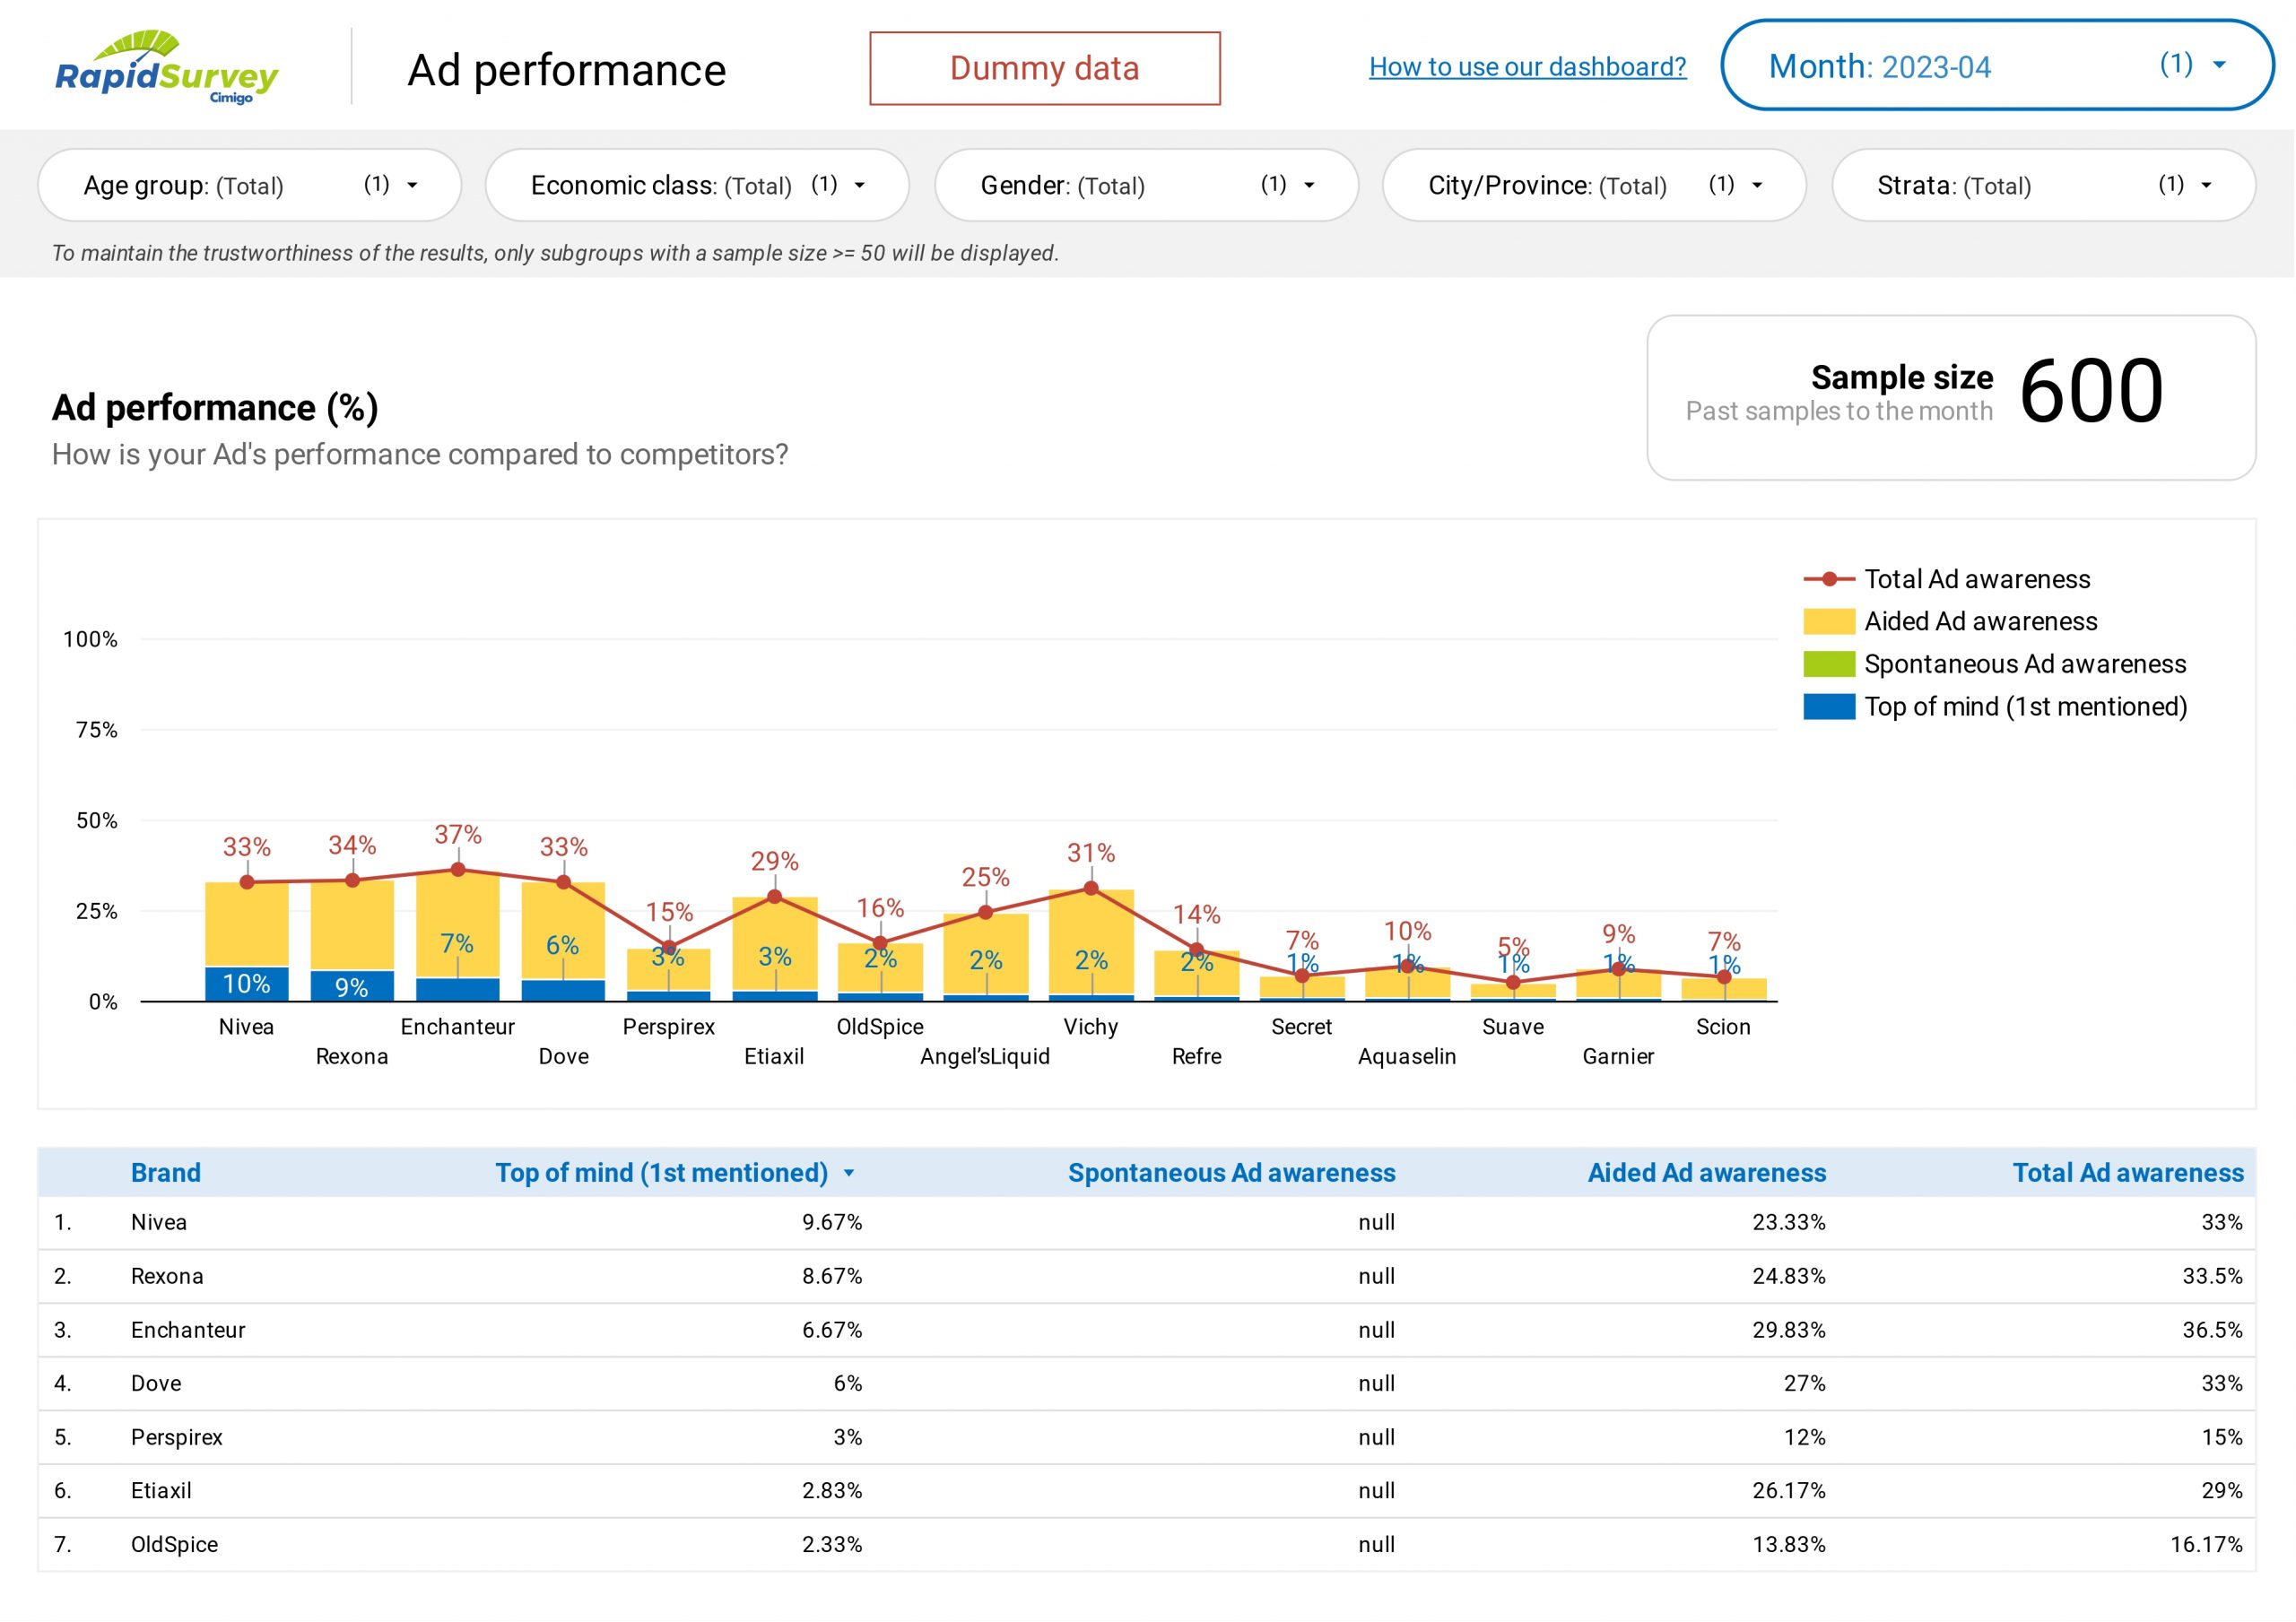
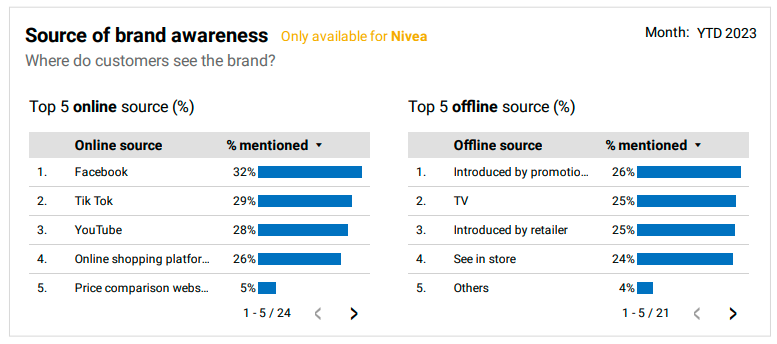
You may assess which online and offline channels are improving brand awareness through either mental and/or physical presence.
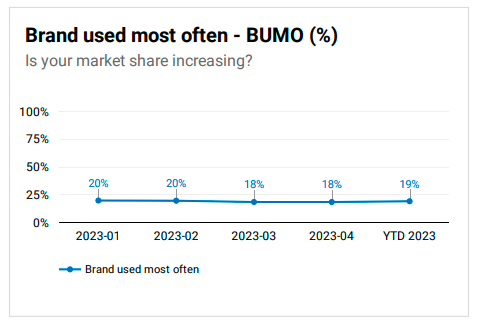
The brand used most often is the metric used for market share.
If your category exhibits different brand dynamics when used at home as opposed to on-premise in outlets (e.g. drinks, tobacco) then your market share is shown for both on-premise and off premise.
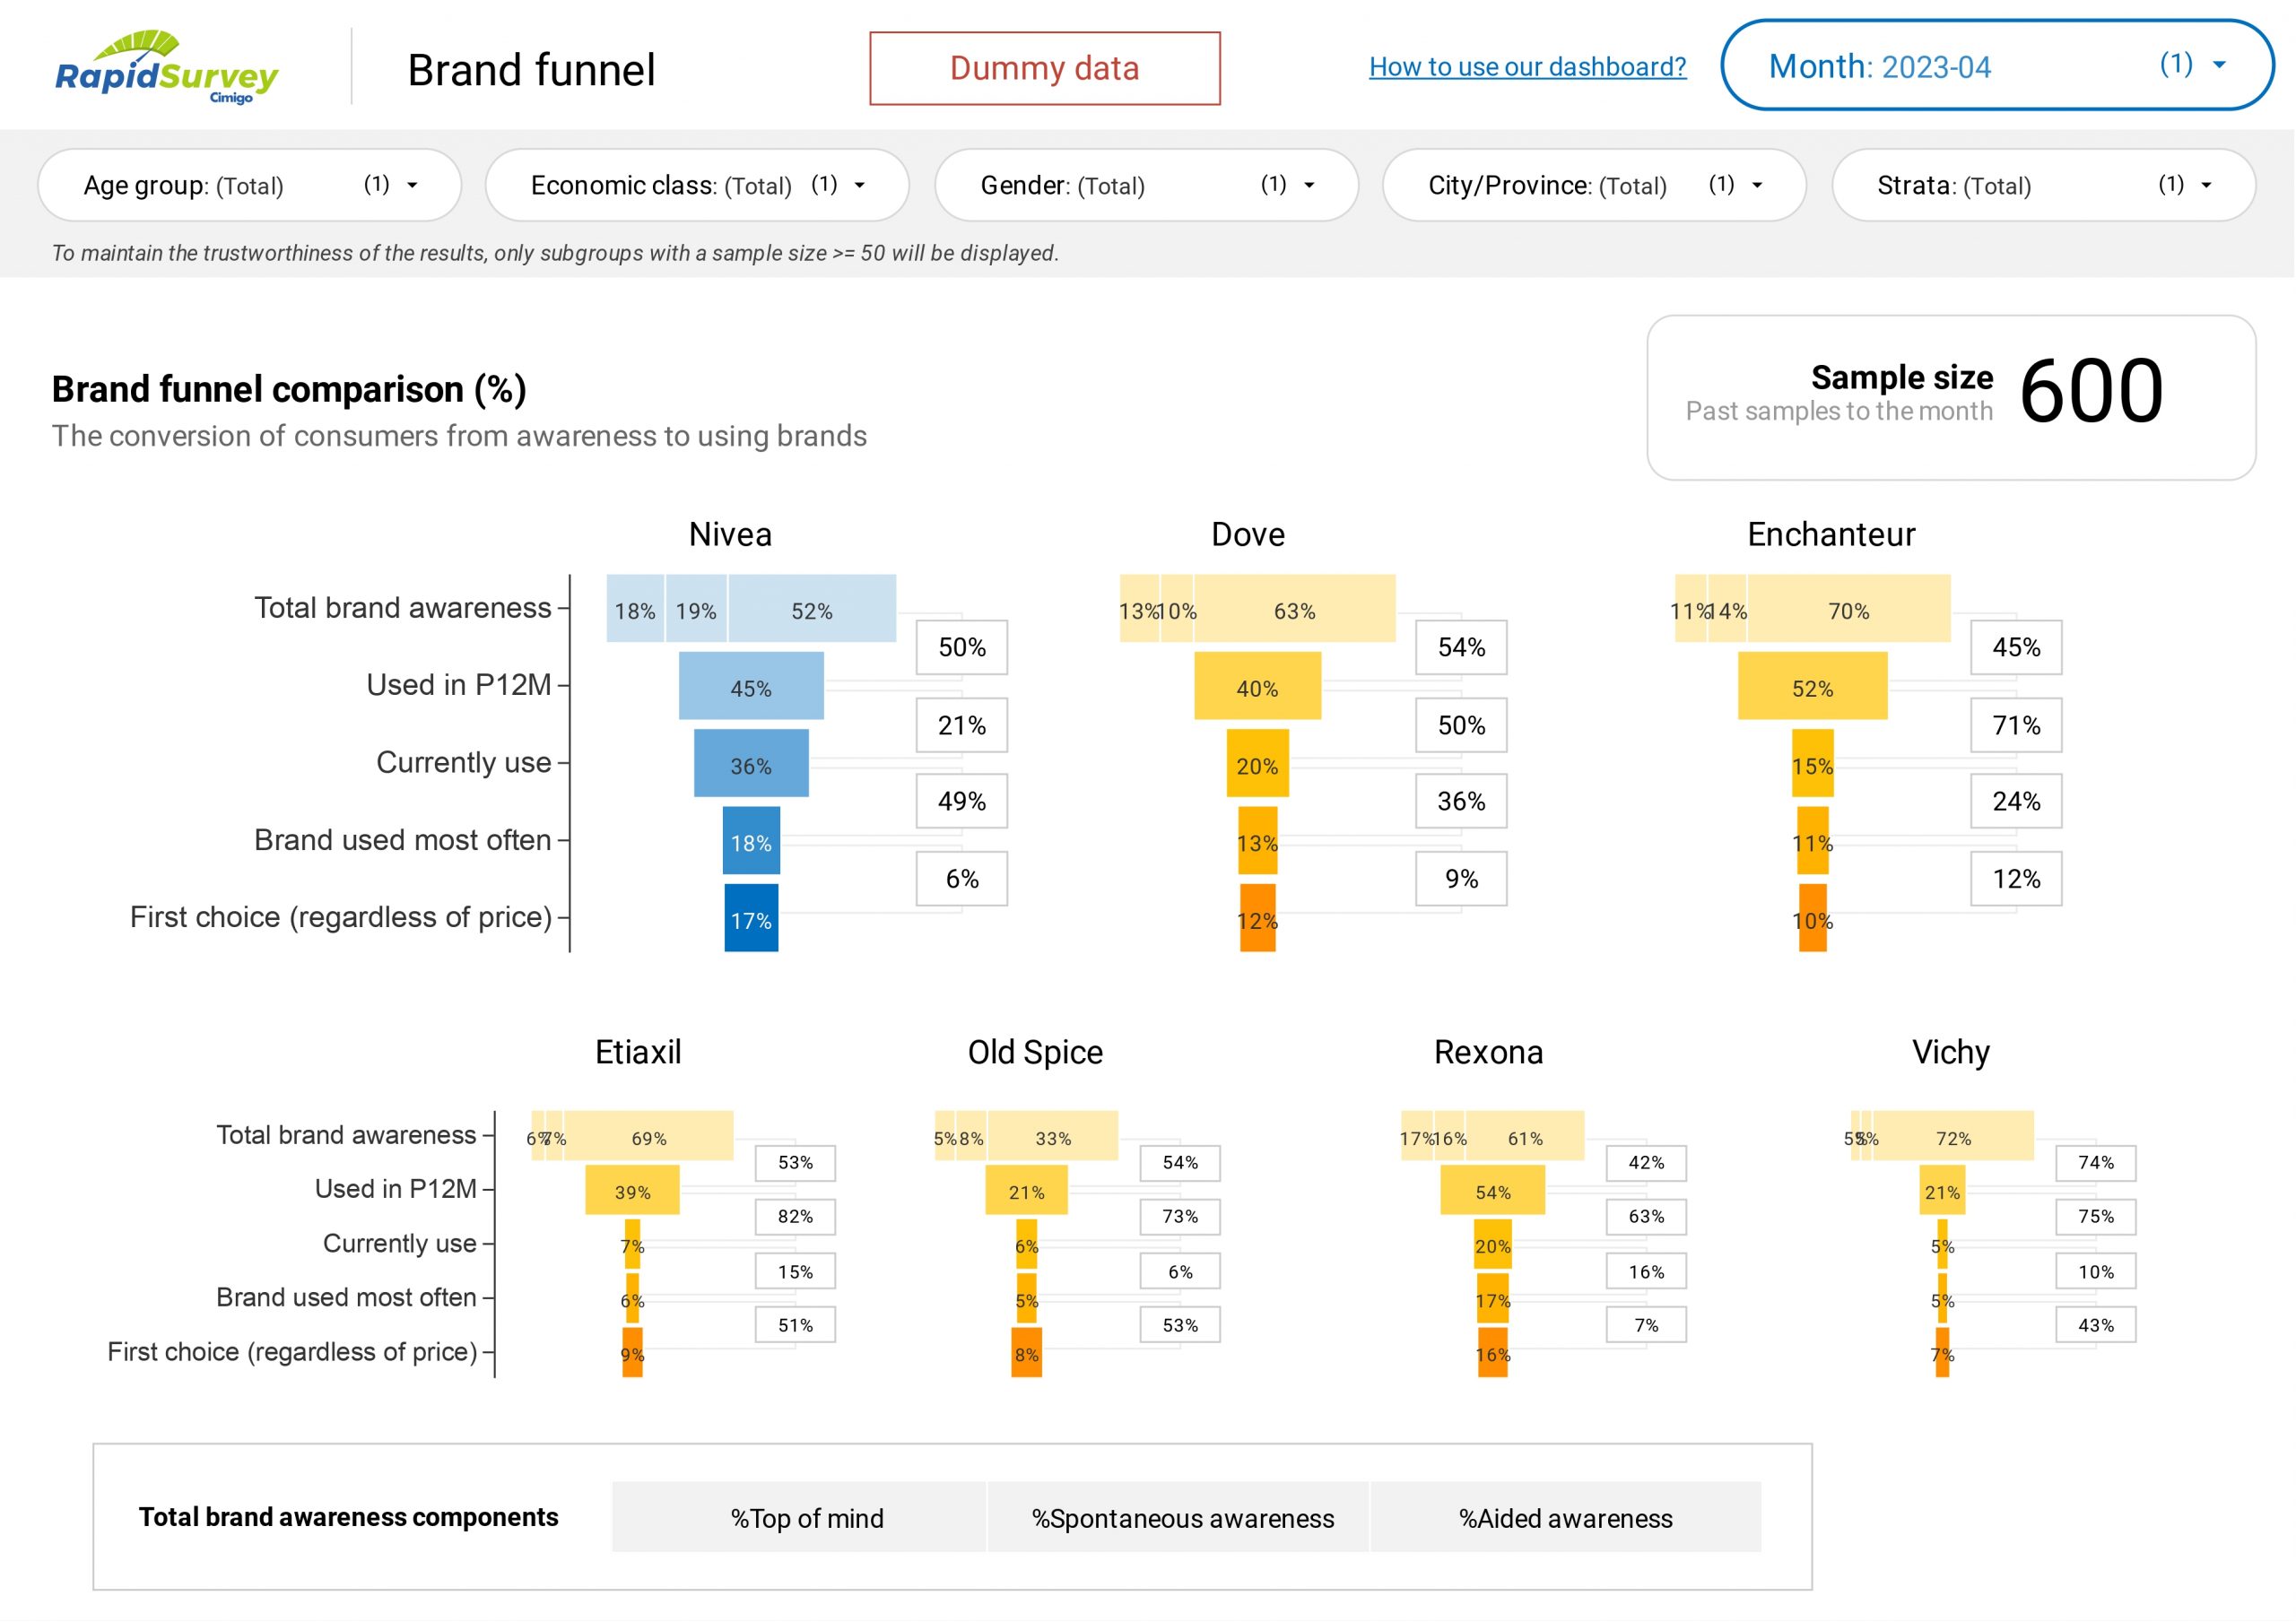
The brand performance funnel is a construct to measure the conversion of consumers from awareness to using your brand and to compare your brand with competitive brands. The key metrics included are below:
The conversion from one metric to the other (for example, at metric 3, you will also find the % of consumers who have used your brand in the past 12 months amongst all consumers aware of your brand (metric 2 above).
Whilst this is a useful analytical construct, the user should be aware that not all paths to purchase follow such a sequential path. For example, I may use the brand for the first time without having known the brand, in this case, awareness may not have always preceded use, but followed use.
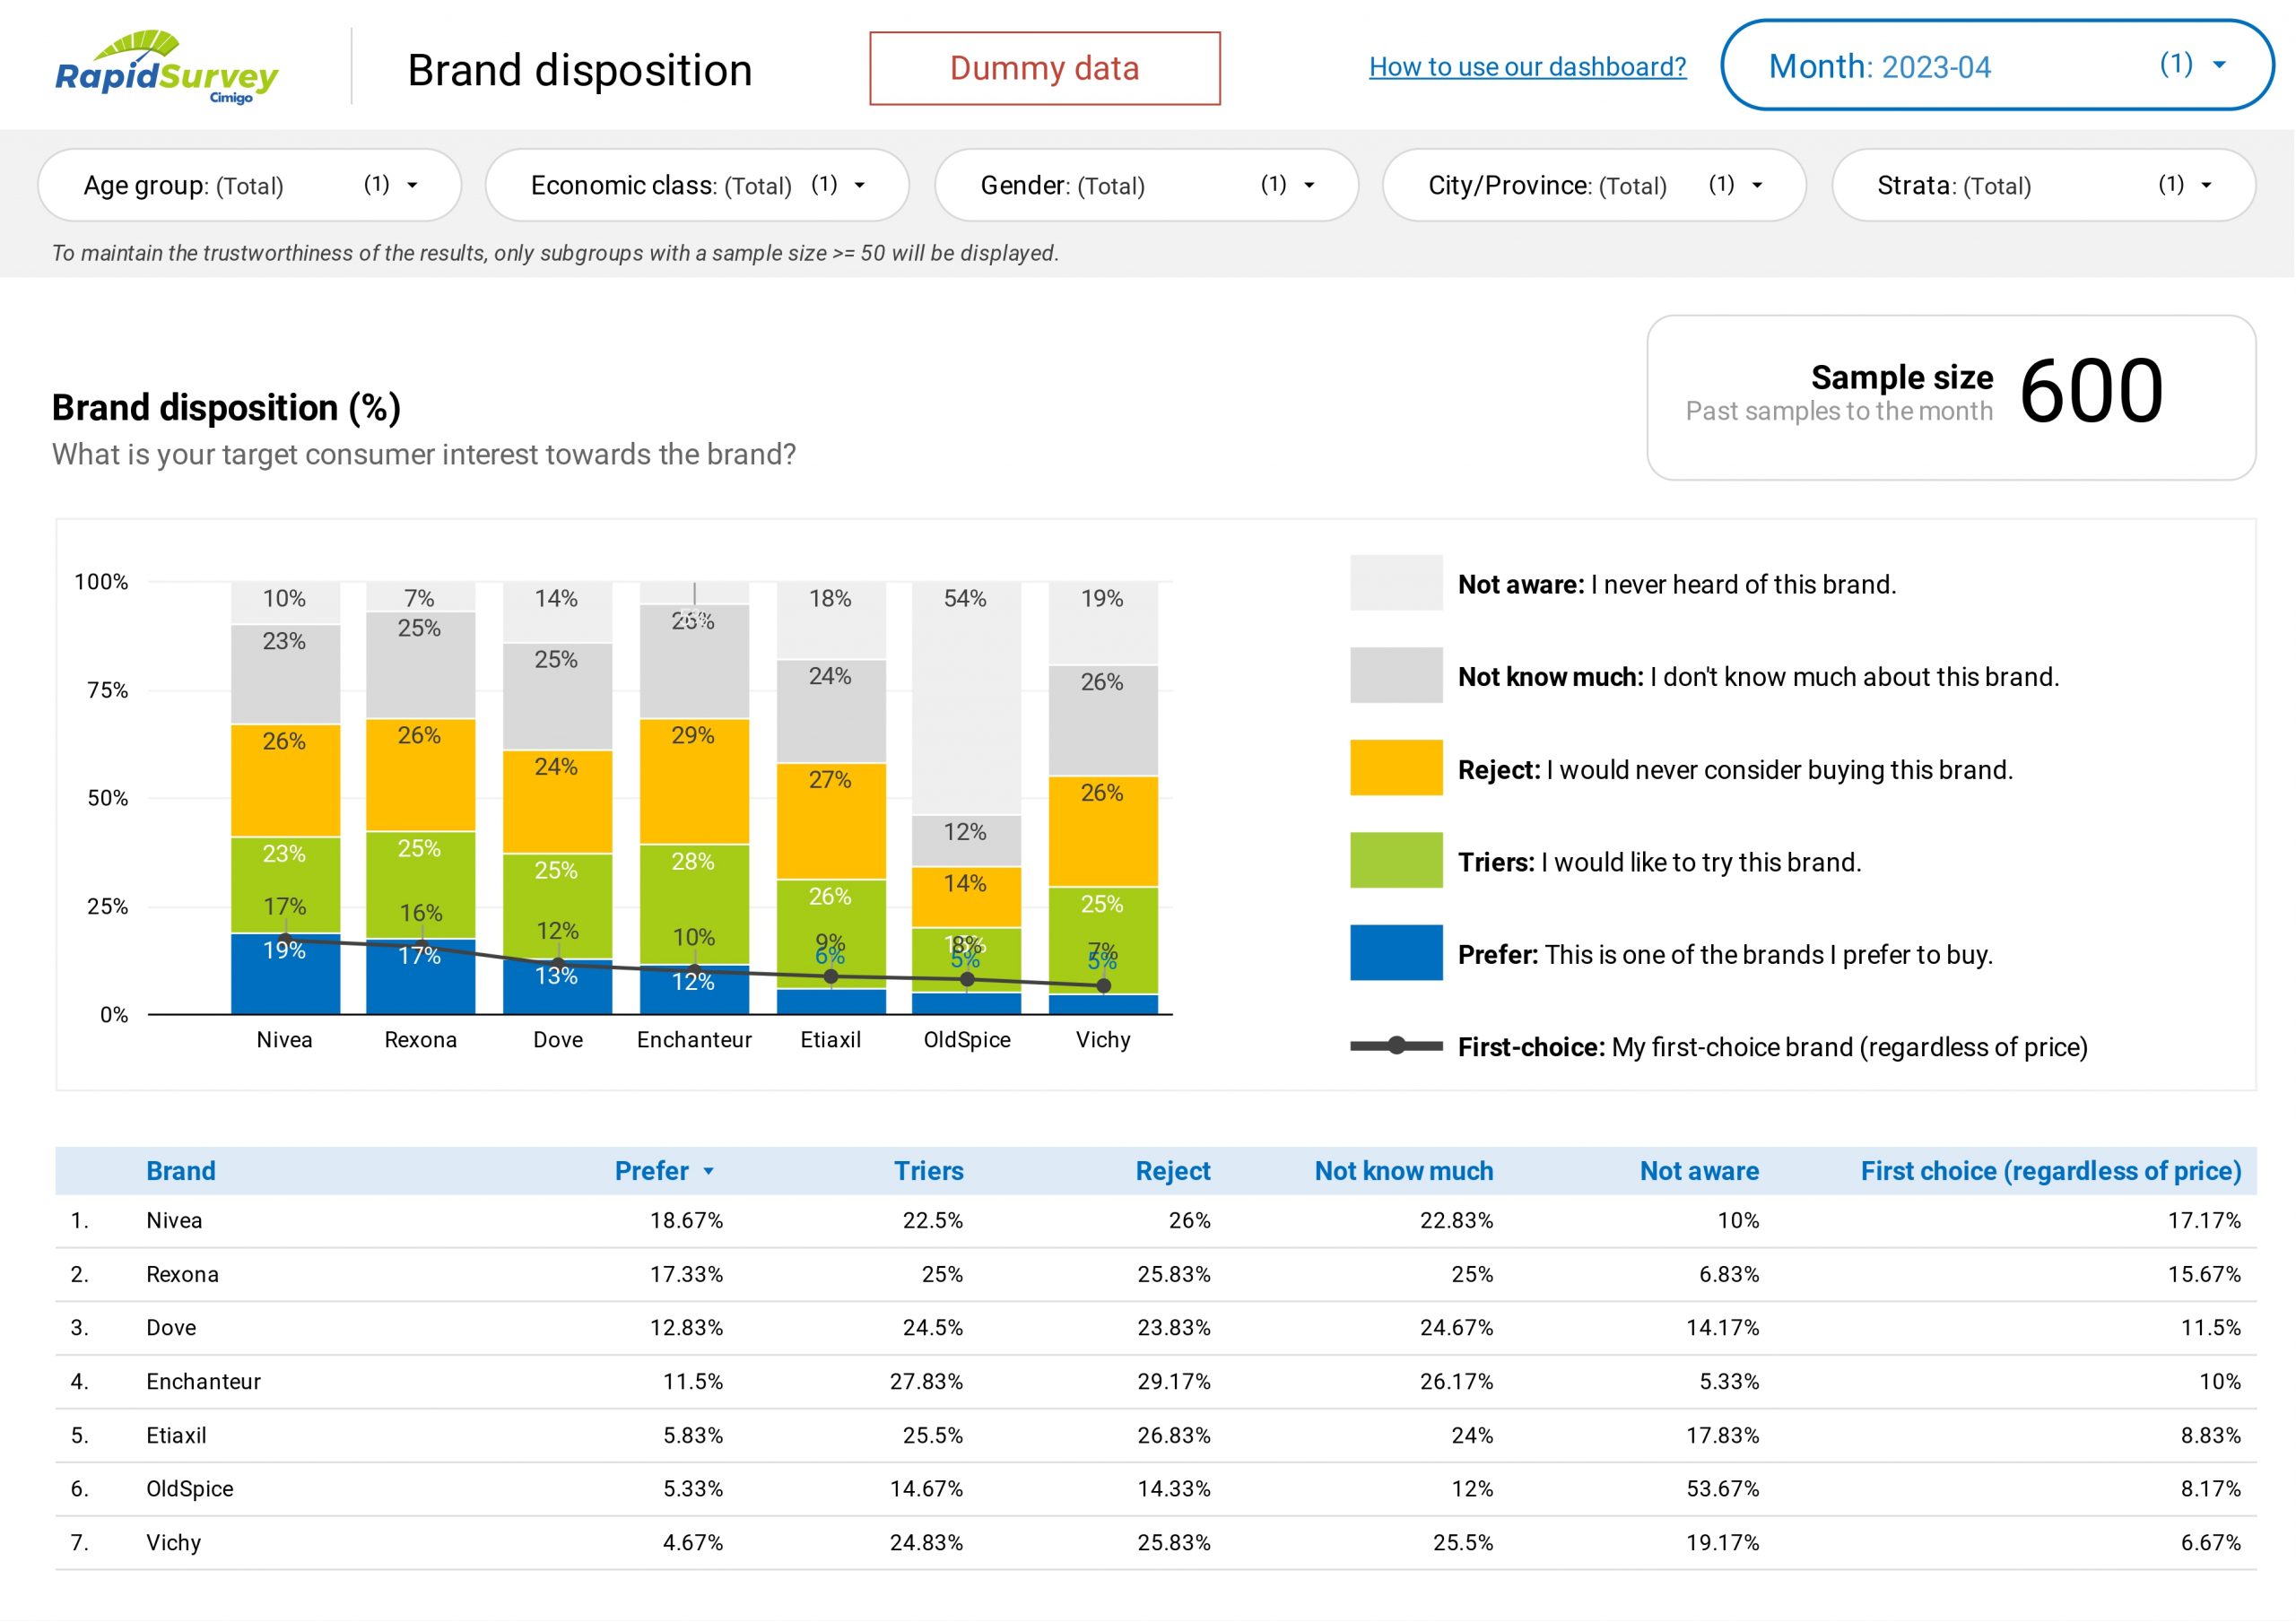
Monitoring the interest in your brand and that of your key competitors helps diagnose how consumer interest towards your brand changes over time and in response to competitive brand management.
The key metrics included are;
Cimigo’s brand health tracking monitor measures how consumers perceive your brand on fourteen attributes. Seven are pre-defined mandatory attributes. The mandatory attributes are;
You may add a further seven optional attributes of your own choosing. Cimigo has provided some pre-defined attributes you may choose from organised under sections; Equity, User personality, Occasions, Gratification, Service and Product.
Alternatively, you can write and add your own attributes. Typically, these would include the intended associations (corresponding to your brand promise or proposition) you seek through to build through your brand management.
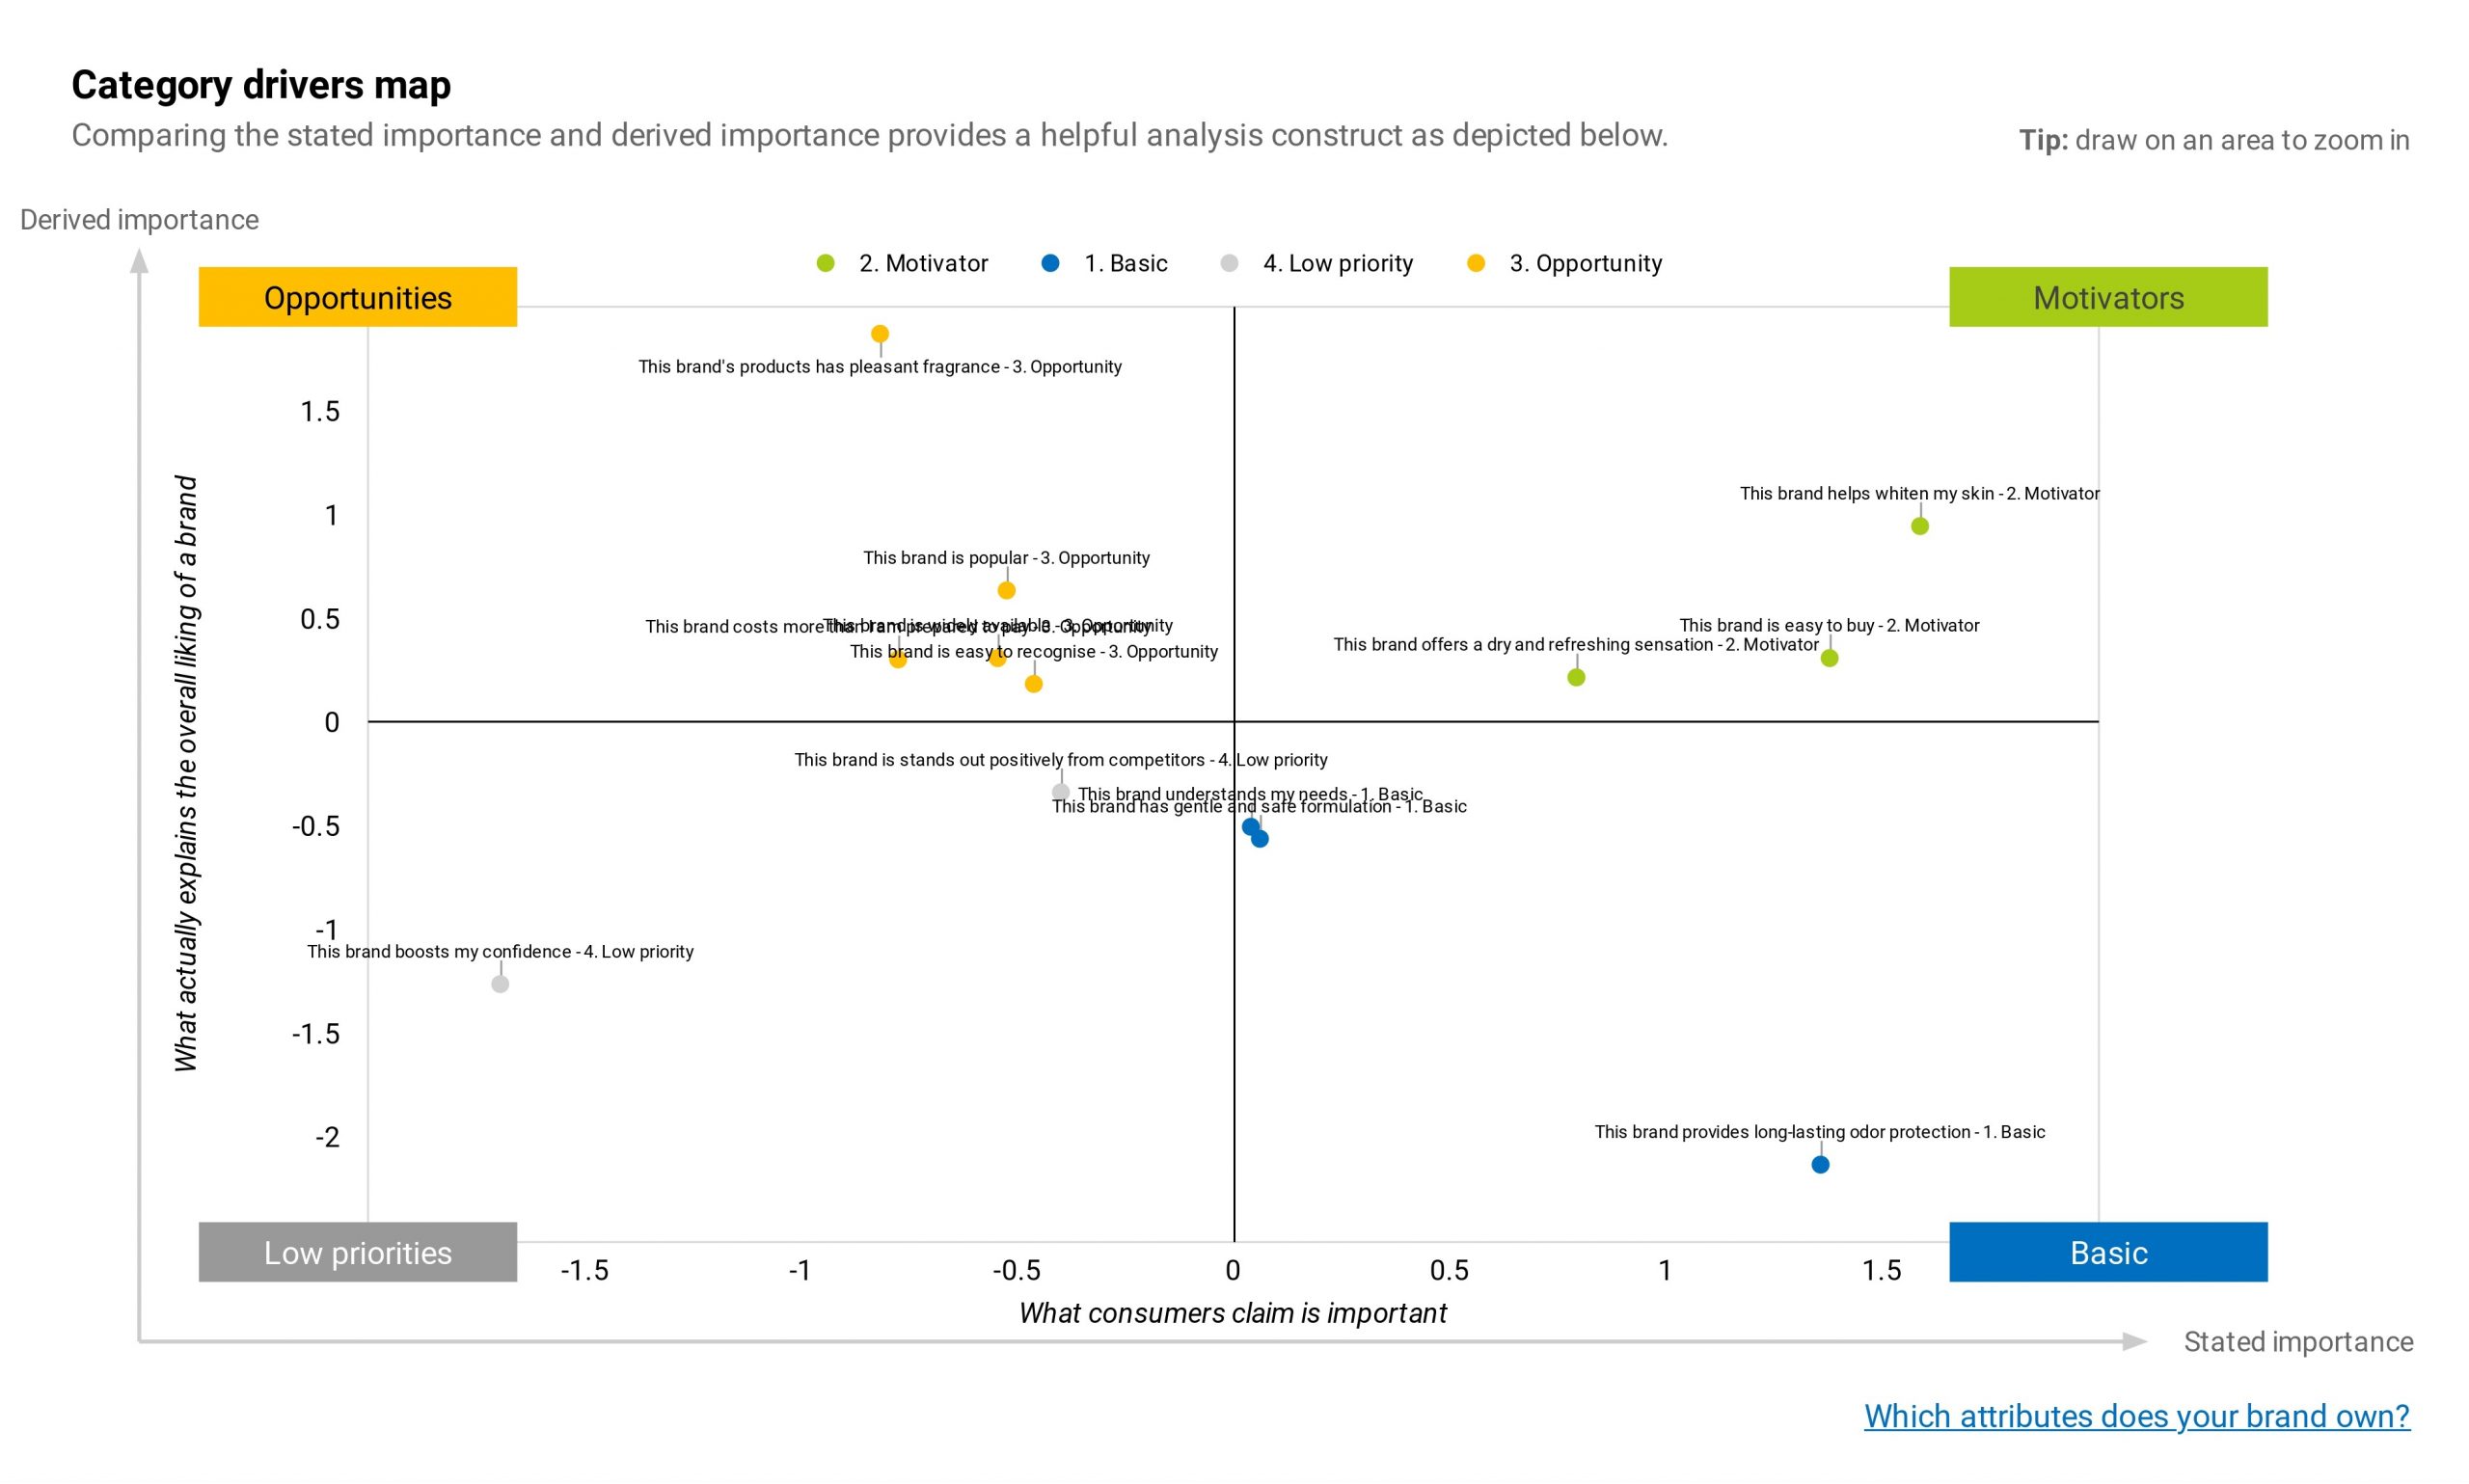
Consumers are asked to rate the importance of these attributes when selecting a brand in your category or industry. Further Cimigo derives (using correlation statistical analysis) which attributes best explain consumers’ appeal towards brands.
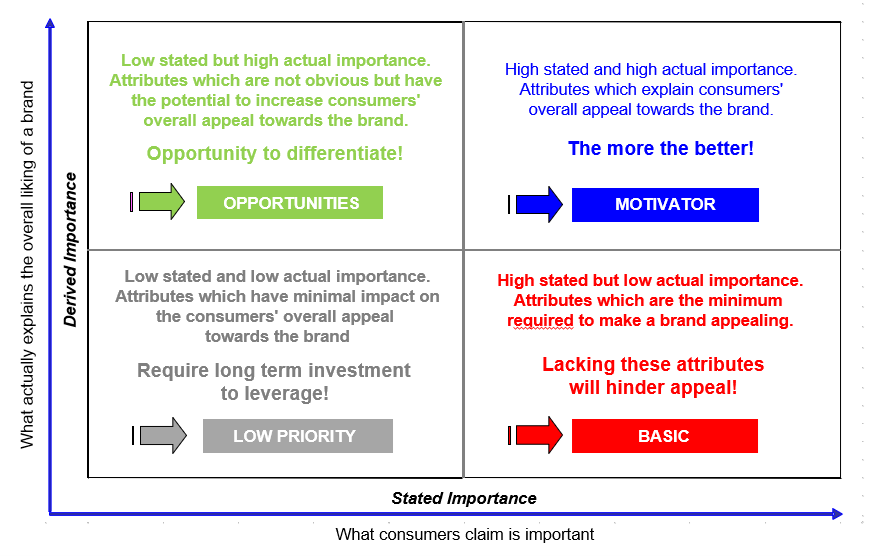
Comparing the stated importance and derived importance provides a helpful analysis construct as depicted below. This is helpful to determine which brand attributes (or equities) make a difference and where to focus brand marketing activities.
When assessing whether your brand’s equity is stronger or weaker than your competitors, it is advisable to look at the attributes through this lens of what is important to your target consumers.
Ideally, your brand is not weakly associated with the Basic attributes. Marketing efforts leverage your brand’s strengths amongst the Motivator attributes to build your brand’s competitive advantage.
If your brand does not own any of Motivator attributes, choose one that you can dominate over your competitors in your product or service and support it in your marketing activities. The Opportunity attributes can help you to differentiate your brand from other competitors.
Cimigo’s brand health tracking monitors consumers’ perception of your brand on fourteen attributes.
Cimigo’s brand health tracking monitors these associations for your brand and up to five competitive brands so a comparison can be readily understood.
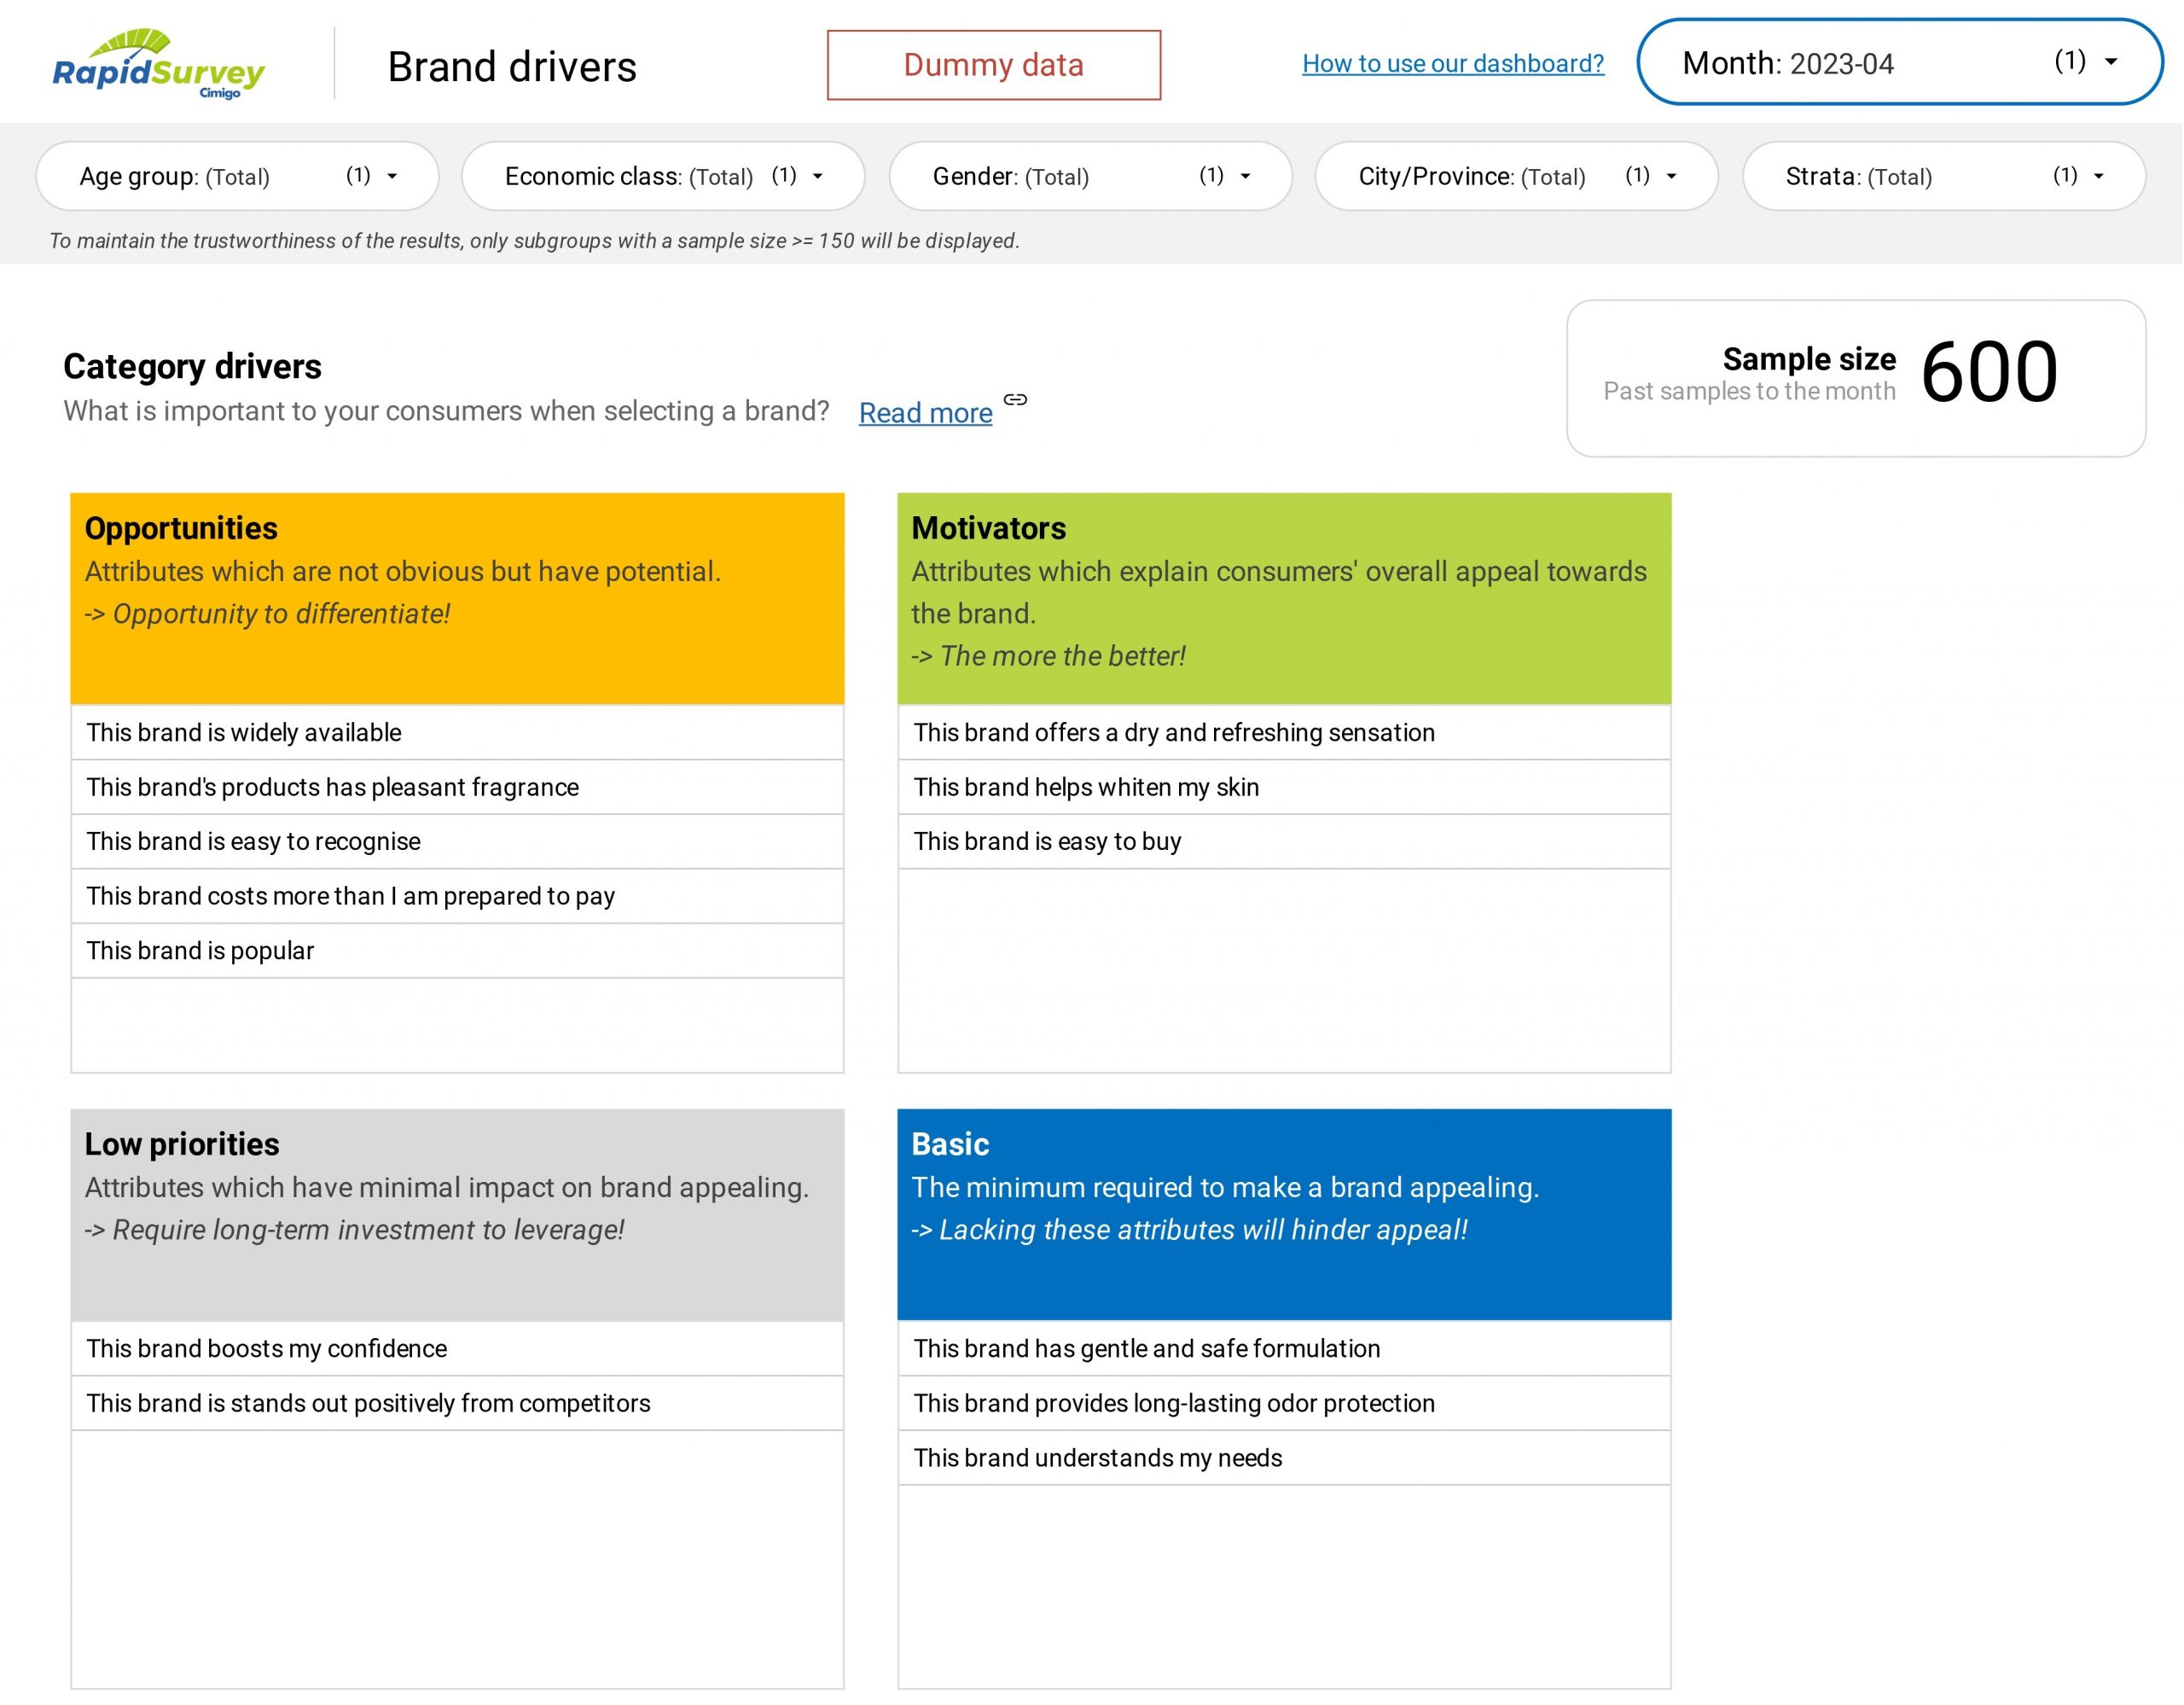
Detailed results on all attributes are included in the dashboard, comparing each competitive brand. The attributes are organised by the attributes which are important to your consumers when selecting a brand, in the four groups detailed below.
Basic. High stated but low derived importance. These attributes are the minimum requirements for a brand to appeal. Weakness in these attributes hinders your brand’s appeal.
Motivators. High both stated and derived importance. These attributes best explain a brand’s appeal. The more motivators that are the strengths of your brand, the better.
Opportunities. Low stated but high derived importance. These attributes are not obvious but can increase your brand’s appeal. These attributes present opportunities to differentiate your brand.
Low priorities. Low stated and low derived importance. These attributes have minimal impact on the appeal of a brand. You do not need to be investing your resources in building these attributes.
Cimigo’s brand health tracking monitors consumers’ perception of your brand on fourteen attributes.
Cimigo’s brand health tracking monitors these associations for your brand and up to five competitive brands so a comparison can be readily understood.
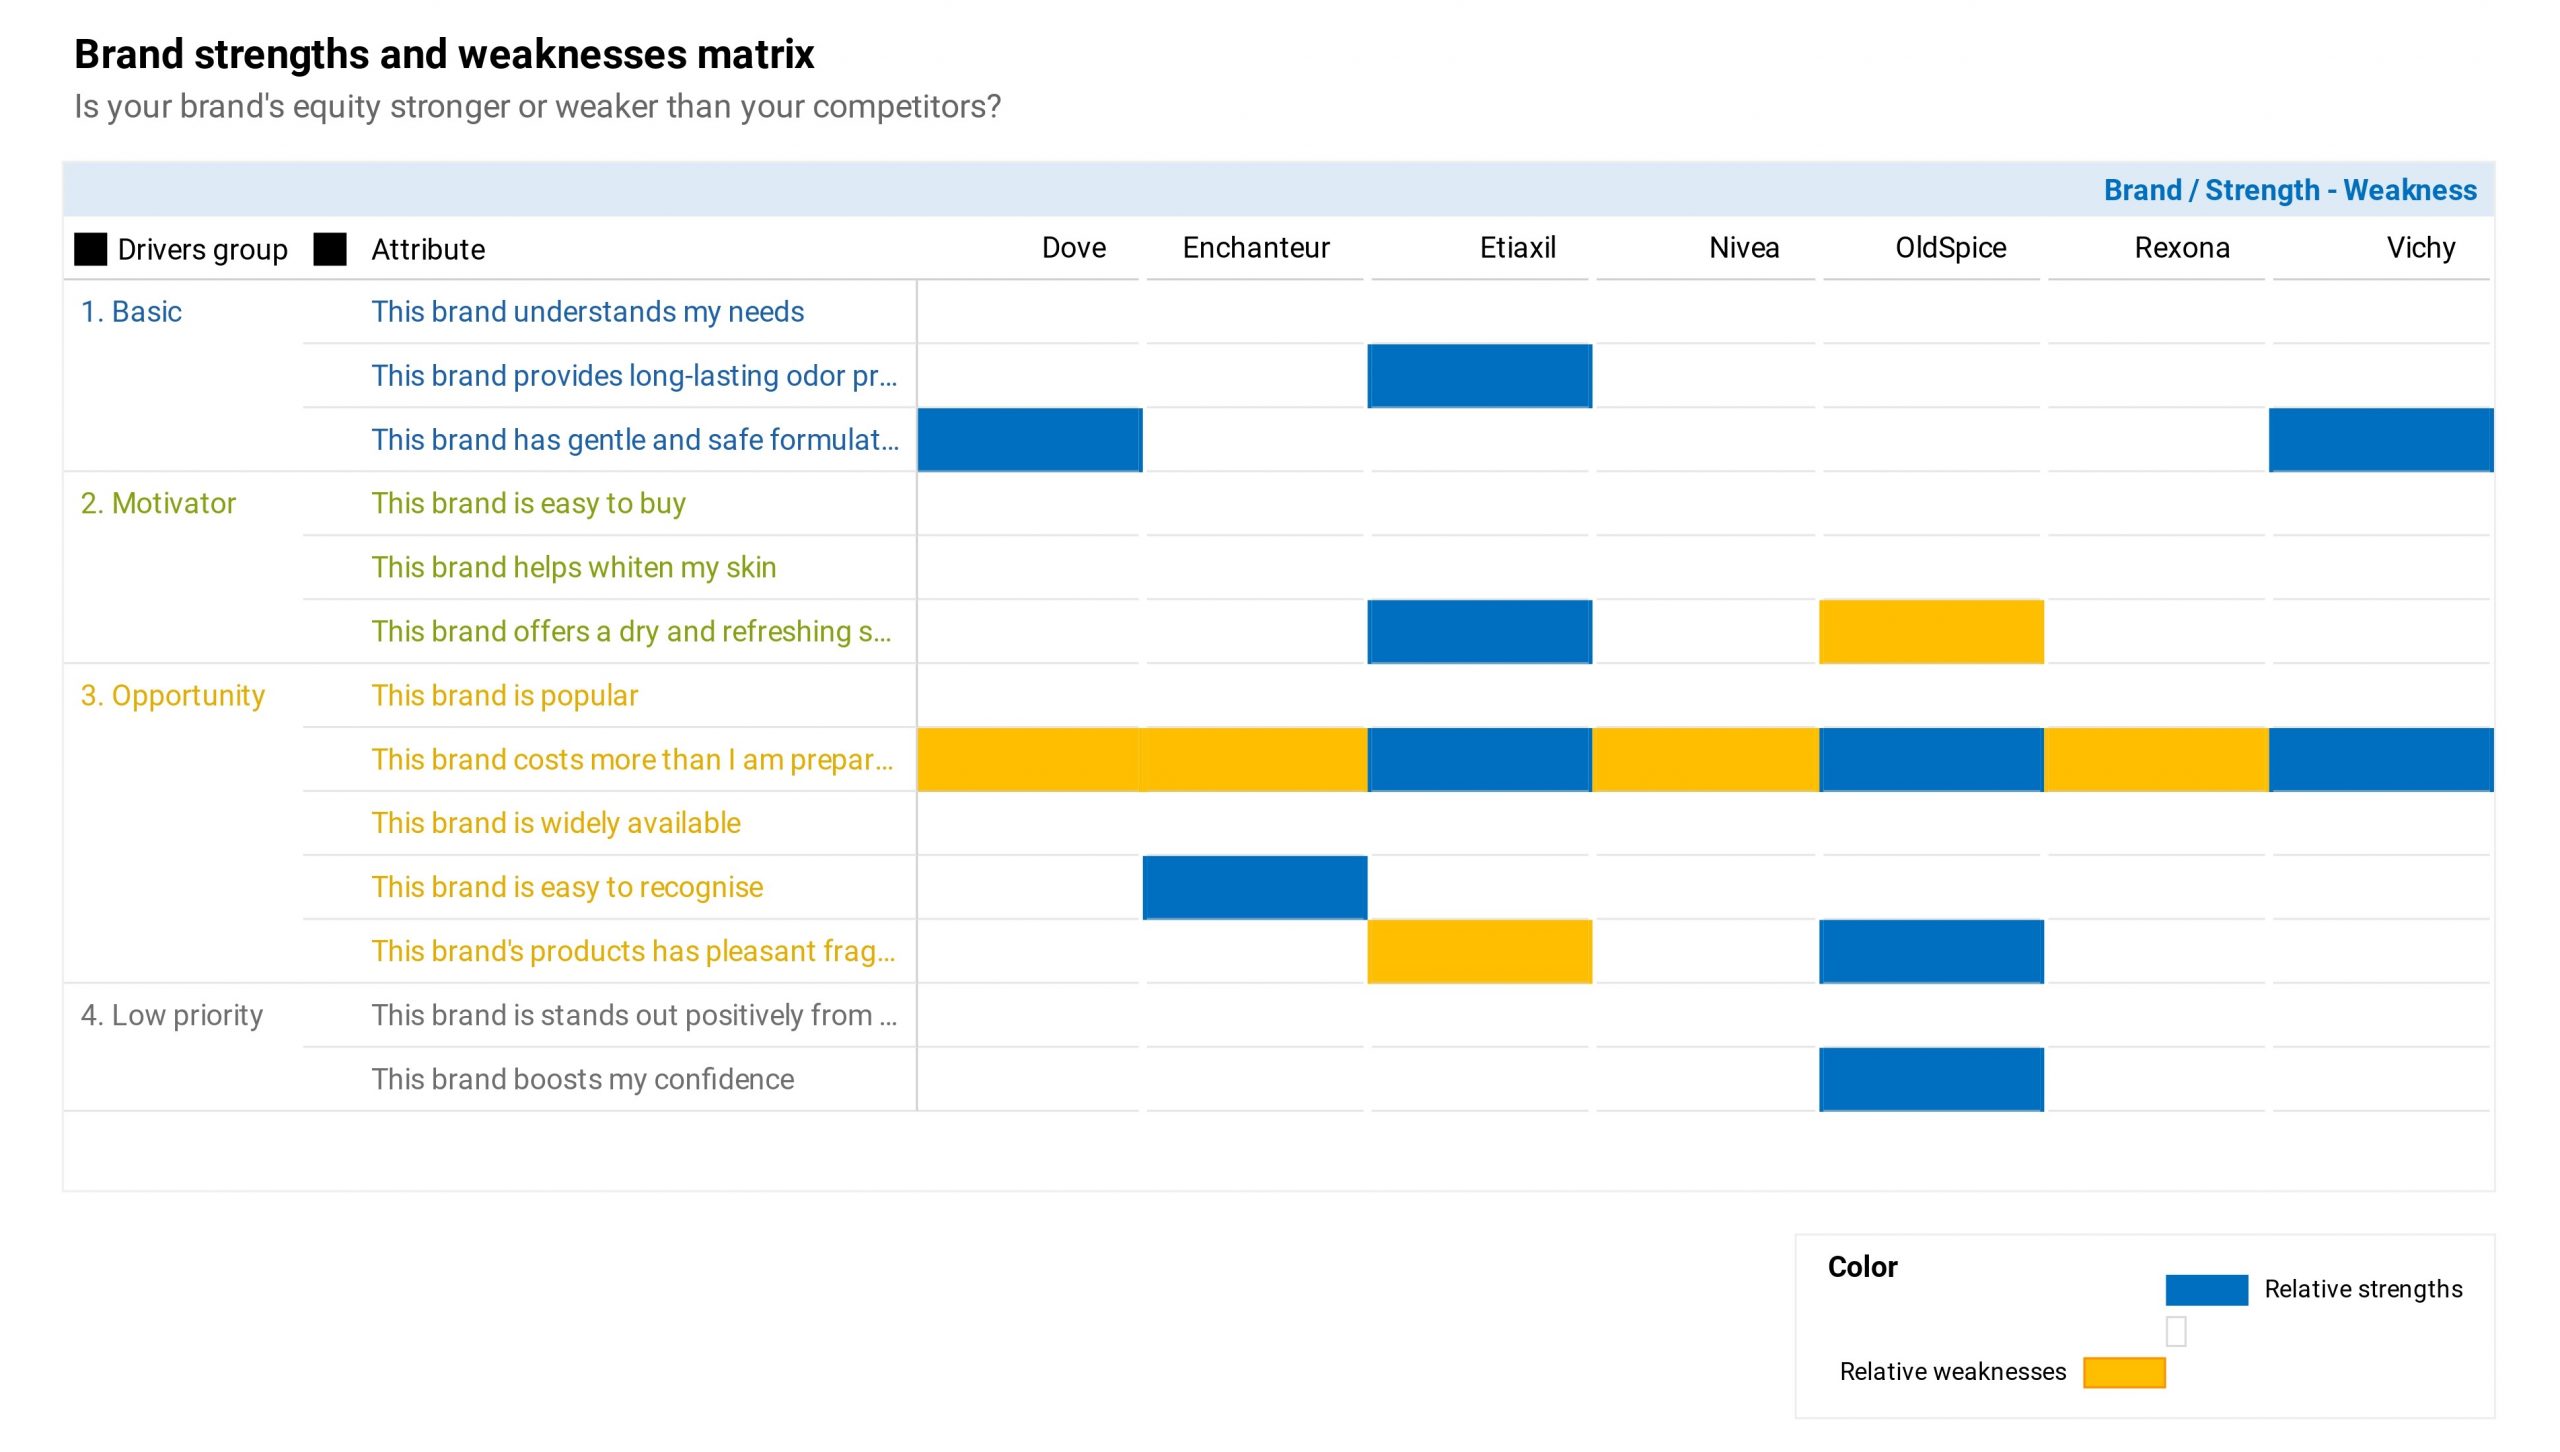
An analytical construct is used to identify your brand’s relative strengths and weaknesses. The attributes are analysed using a statistical tool named chi-square normalisation. This tool corrects the distortion that the size of a brand has on the absolute scores of consumer associations. For example, a brand like Coca-Cola with a large market share attracts more associations than a brand like Big Cola with a smaller market share, making performance for smaller brands difficult to gauge.
The statistical tool output is a normalised score for each attribute with which you can gauge comparative strengths and weaknesses across the brands. In many cases, brands will not have any strengths but should strive to have them.
The attributes are organised by the attributes which are important to your consumers when selecting a brand, in the four groups detailed above.
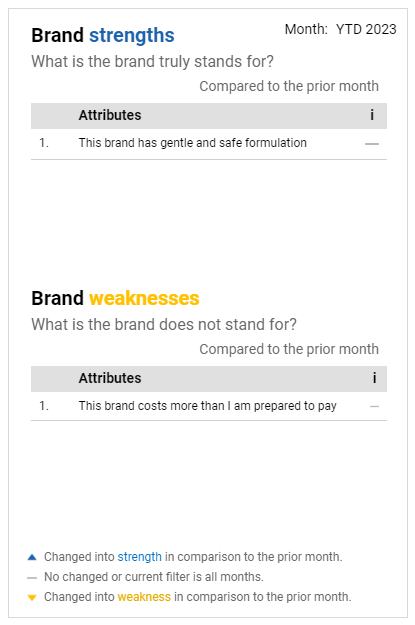
Using the aforementioned comparative strengths and weaknesses of your brand’s equity, you can identify what (if anything) your brand truly stands for in consumers’ minds and just as importantly, what it does not stand for.
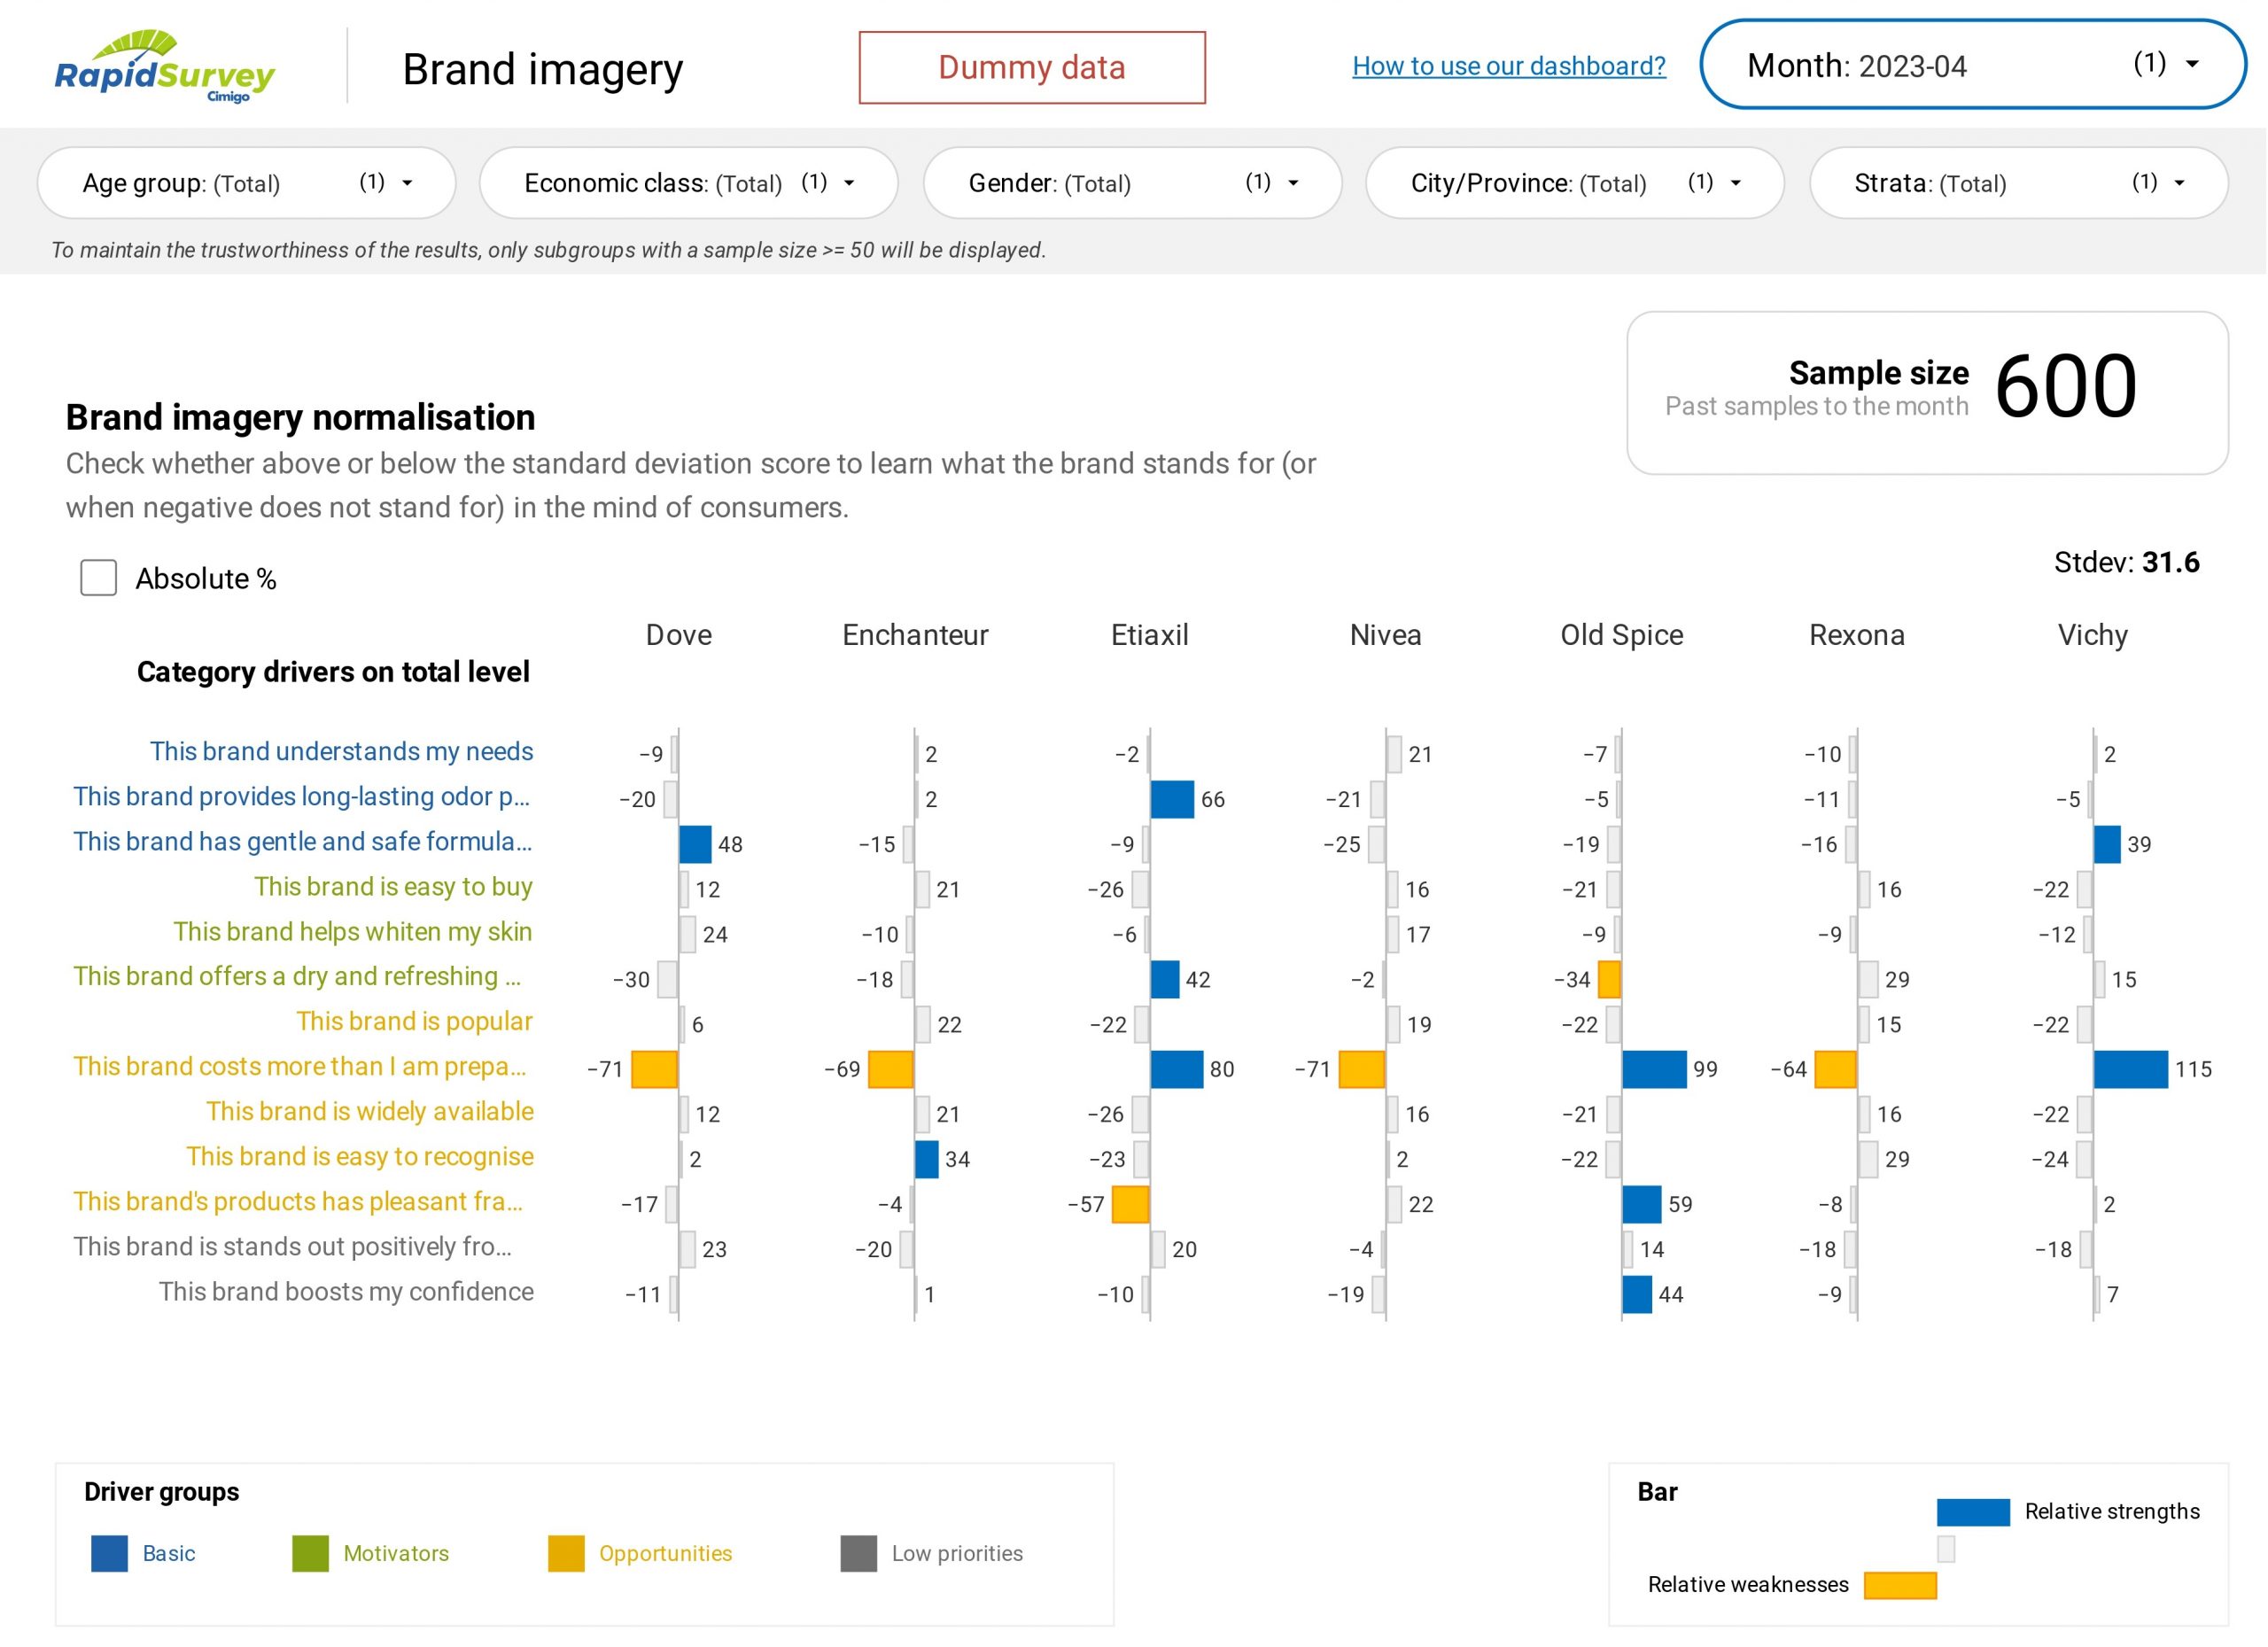
The normalised scores for the attributes (equities) are used to determine each brand’s relative strengths and weaknesses. The normalised scores are compared to the standard deviation. Scores higher than the standard deviation indicate a strength (when positive) or weakness (when negative).
In many cases, no brand will stand out from other brands, with a specific strength or a specific weakness. The category or industry exhibits minimal or no differentiation across brands. This highlights a risk as one brand may readily be substituted for another. Alternatively, this highlights an opportunity for a brand team willing to build differentiated equity (attributes) for their brand.
The dashboard shows only the attributes (equities) that apply to your brand compared with competitive brands. When empty, the brand does not stand for anything amongst the attributes (equities) measured.
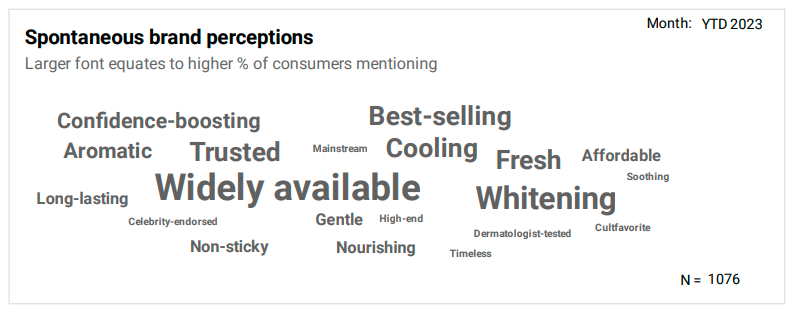
Cimigo’s brand health tracking monitor also includes a word association presented as a word cloud. Here the bigger words are mentioned more by consumers than the smaller words.
Cimigo’s brand health tracking monitor asks consumers to describe brands with two words of their choosing. This supports other more structured quantitative metrics assessing consumer perceptions of your brand.
The word cloud can be useful if the category or industry exhibits well differentiated brands. Many categories and industries exhibit minimal or no differentiation across brands. If this is the case, the word cloud is not helpful and the conclusion may well be that your brand is a “me-too” brand in a sea of similar brands.
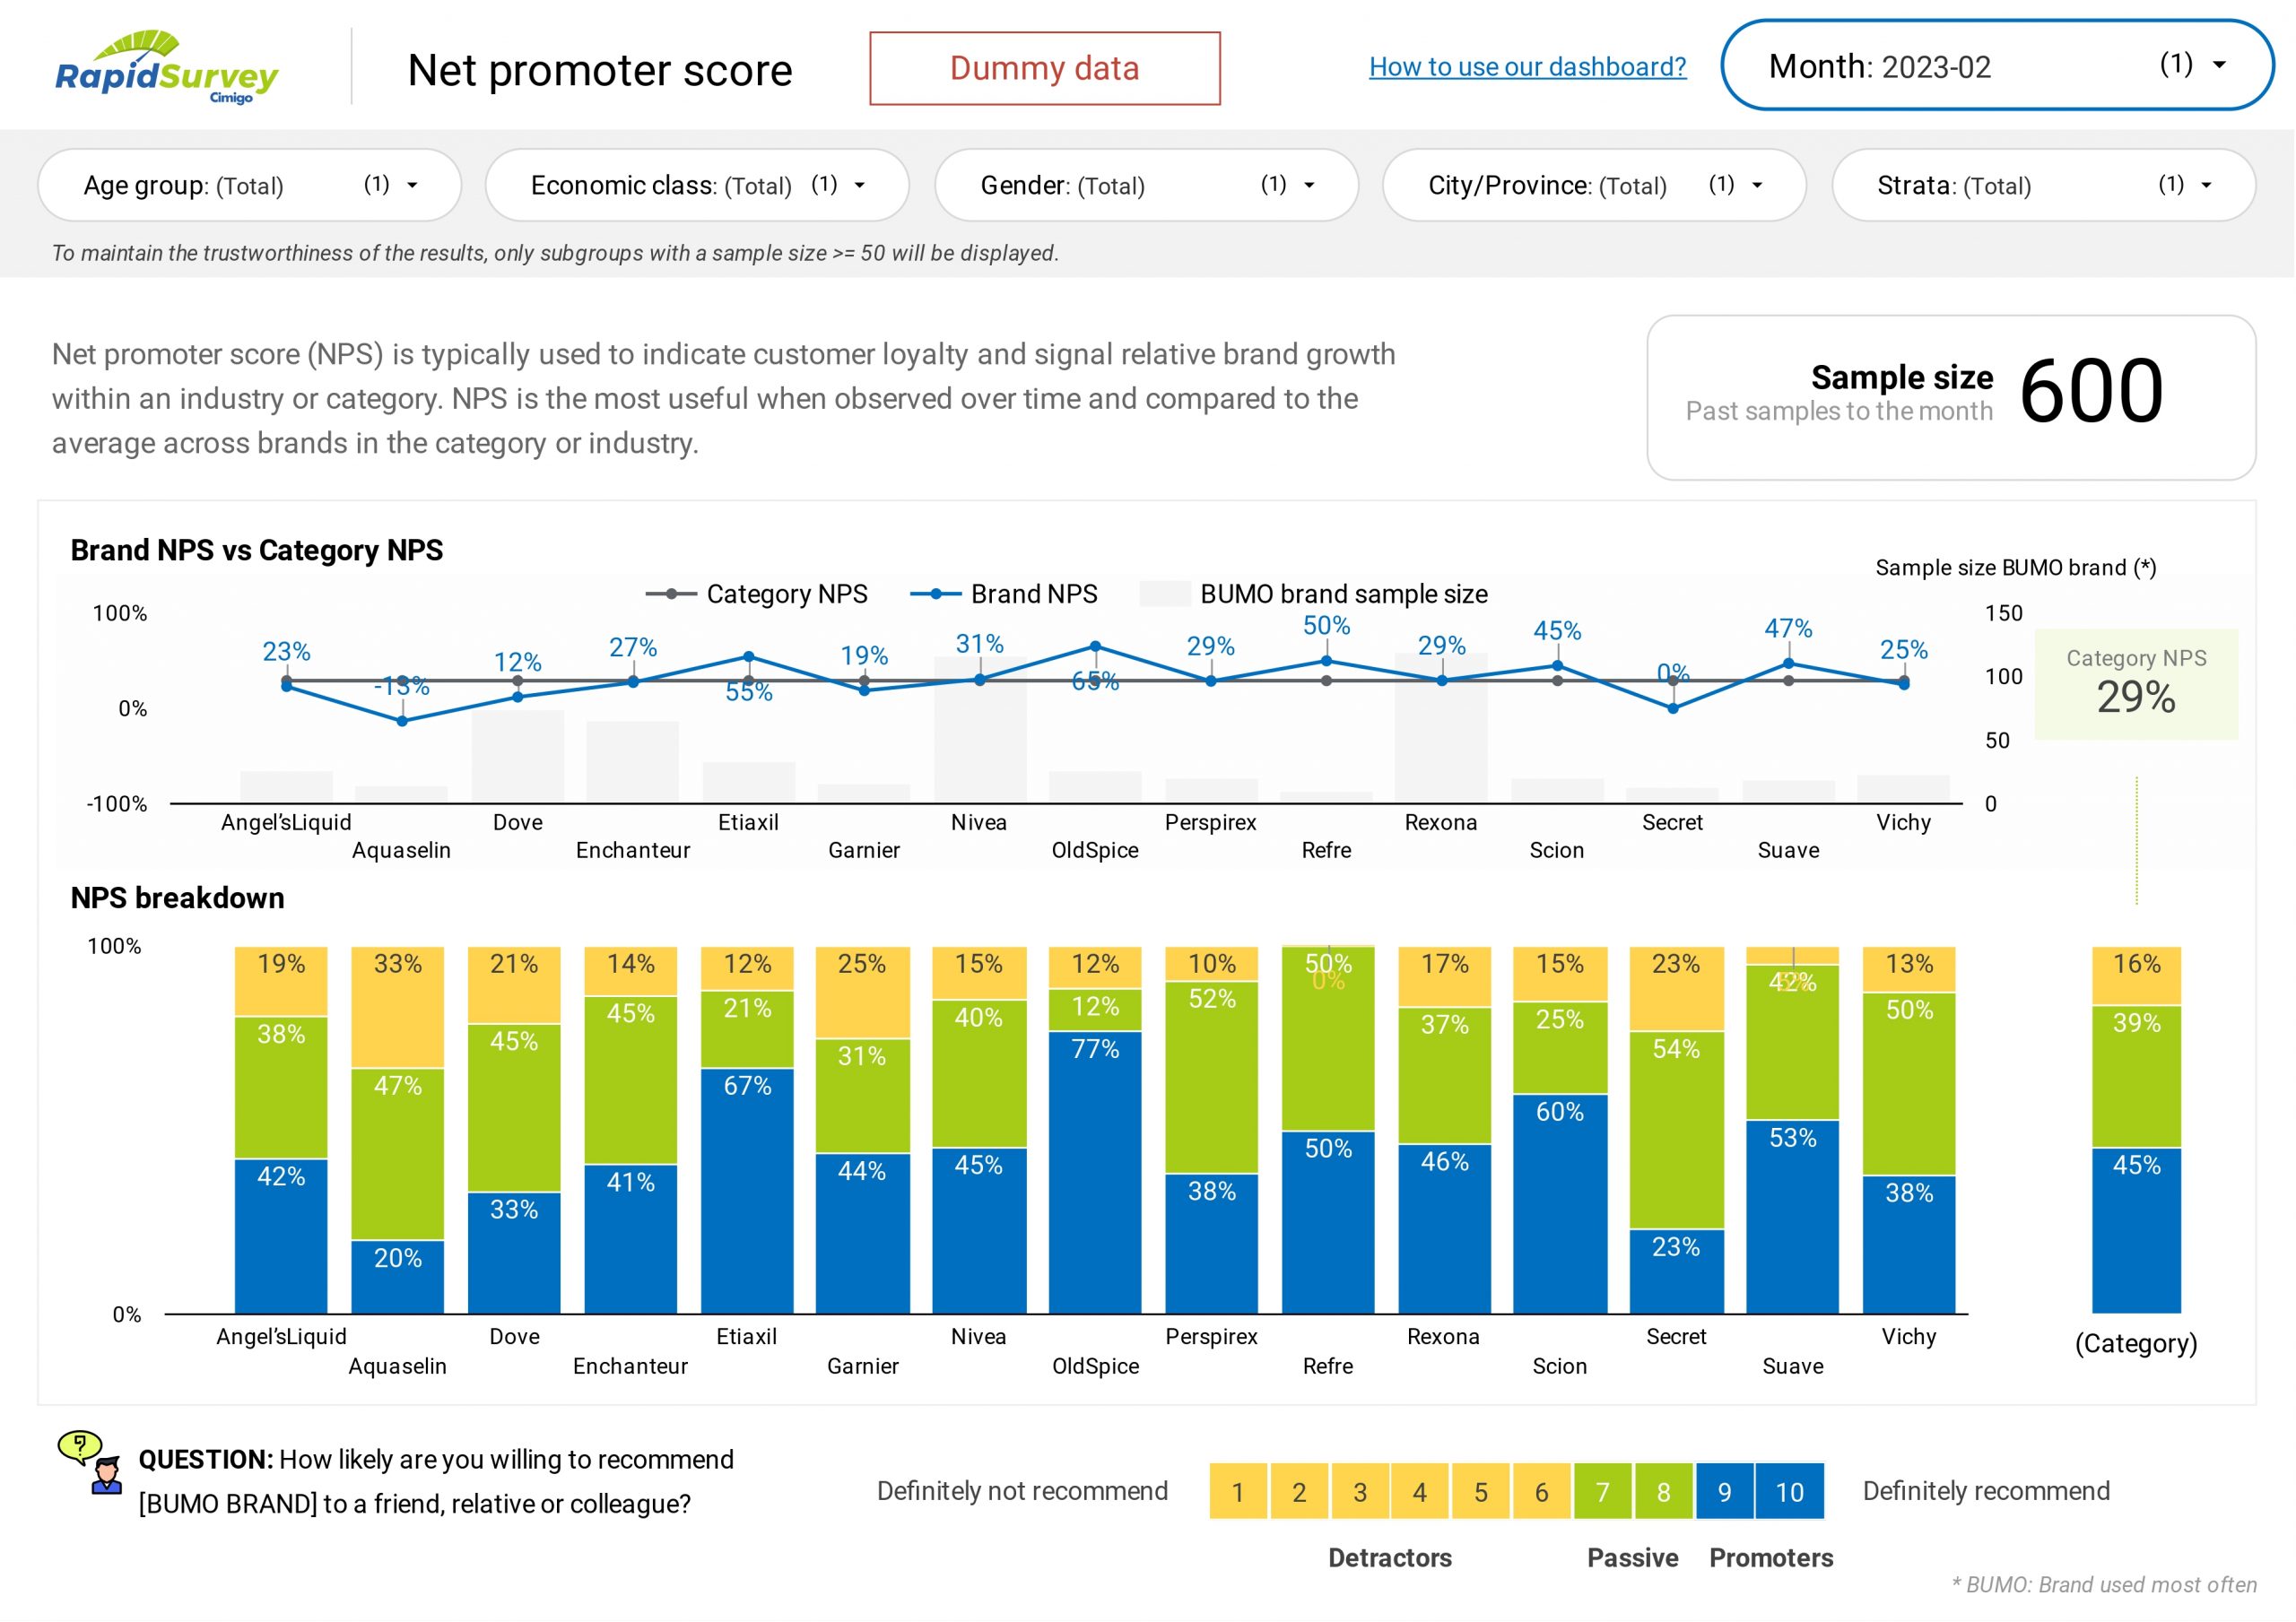
Consumers are asked how likely they are to recommend the brand which they use most often. This metric is known as a net promoter score (NPS).

NPS is a widely used market research metric that is based on a single survey question asking respondents to rate the likelihood that they would recommend a brand to a friend. The NPS is typically used to indicate customer loyalty and signal relative brand growth within an industry or category.
This metric is more relevant to assessing services or high-value products or services, as opposed to mass consumer goods or low value products and services, which require more involved (as opposed to impulse) decision-making.
NPS is the most useful when observed over time and in comparison, to the average across brands in the category or industry. The NPS for competing brands is shown over time and is compared to an average for all brands in the category or industry.
You can access the live example dashboard (with dummy data) using this link: https://link.cimigo.com/rsbm
If you have questions, please get in touch with Cimigo at ask@cimigo.com for support.

Brand health tracking solution
May 18, 2023
For VND38,250,000 (US$1,500) per month, you can monitor your brand and learn how your hard work
Brand health check solution
Nov 14, 2024
For VND63,724,500 (US$2,499), you can measure and diagnose your brand’s health amongst 300
Unlocking pricing insights with a price sensitivity meter
Oct 12, 2023
Pricing is a critical element in any business strategy. Set it too high, and you risk alienating
Đoàn Ngọc Huy (Johnny Doan), CMO & Market Research Expert -
As a Marketing Director and Market Research Expert Advisor across international markets, I have collaborated with numerous market research agencies, both global and local, that operate with a high level of professionalism and effectiveness. Cimigo is among the most outstanding. The Cimigo team demonstrates exceptional professionalism, strong commitment, and operational excellence. From research design and fieldwork execution to insight analysis, all stages are conducted rigorously, delivered on schedule, and closely aligned with business objectives. This is a highly capable team that I would confidently recommend to my partners and stakeholders.
As a Marketing Director and Market Research Expert Advisor across international markets, I have collaborated with numerous market research agencies, both global and local, that operate with a high level of professionalism and effectiveness. Cimigo is among the most outstanding. The Cimigo team demonstrates exceptional professionalism, strong commitment, and operational excellence. From research design and fieldwork execution to insight analysis, all stages are conducted rigorously, delivered on schedule, and closely aligned with business objectives. This is a highly capable team that I would confidently recommend to my partners and stakeholders.
Lisa Nguyen - Vietnam Marketing Lead
Mark Ratcliff - Managing Director
The team at Cimigo are my favourite researchers in South East Asia. They’ve proved adept at tackling the most private and complex personal issues at qualitative research level, not flinching when the client endlessly chopped and changed fieldwork timing, or ramped up the workload without warning. They have recruited the most extraordinarily niche consumers without pause or complaint. Their patience with clients and their flexibility and hard work that went above and beyond what was initially asked of them on two projects relating to sexual behaviour means there is now no other research company we would choose to work with in that part of Asia. The fact they also pulled off a third project for us so well, on men’s relationship with beer and beer advertising, shows they have breadth of expertise— we still quote from the report they produced.
The team at Cimigo are my favourite researchers in South East Asia. They’ve proved adept at tackling the most private and complex personal issues at qualitative research level, not flinching when the client endlessly chopped and changed fieldwork timing, or ramped up the workload without warning. They have recruited the most extraordinarily niche consumers without pause or complaint. Their patience with clients and their flexibility and hard work that went above and beyond what was initially asked of them on two projects relating to sexual behaviour means there is now no other research company we would choose to work with in that part of Asia. The fact they also pulled off a third project for us so well, on men’s relationship with beer and beer advertising, shows they have breadth of expertise— we still quote from the report they produced.
Kevin McQuillan - Chief Marketing Officer
Sam Houston - Chief Executive Officer
Minh Thu - Consumer Market Insights Manager
Travis Mitchell - Executive Director
Malcolm Farmer - Managing Director
Hy Vu - Head of Research Department
Joe Nelson - New Zealand Consulate General
Steve Kretschmer - Executive Director
York Spencer - Global Marketing Director
Laura Baines - Programmes Snr Manager
Mai Trang - Brand Manager of Romano
Hanh Dang - Product Marketing Manager
Luan Nguyen - Market Research Team Leader
Max Lee - Project Manager
Chris Elkin - Founder
Ronald Reagan - Deputy Group Head After Sales & CS Operation
Chad Ovel - Partner

Private English Language Schools - Chief Executive Officer
Rick Reid - Creative Director

Anya Nipper - Project Coordination Director

Dr. Jean-Marcel Guillon - Chief Executive Officer
Joyce - Pricing Manager

Matt Thwaites - Commercial Director
Aashish Kapoor - Head of Marketing
Kelly Vo - Founder & Host
Thanyachat Auttanukune - Board of Management
Hamish Glendinning - Business Lead

Thuy Le - Consumer Insight Manager
Richard Willis - Director
Ha Dinh - Project Lead
Geert Heestermans - Marketing Director
Vo Thi Thuy Ha - Commercial Effectiveness
Louise Knox - Consumer Technical Insights

Aimee Shear - Senior Research Executive
Dennis Kurnia - Head of Consumer Insights
Tania Desela - Senior Product Manager
Thu Phung - CTI Manager
Linda Yeoh - CMI Manager

Cimigo’s market research team in Vietnam and Indonesia love to help you make better choices.

Cimigo provides market research solutions in Vietnam and Indonesia that will help you make better choices.

Cimigo provides a range of consumer marketing trends and market research on market sectors and consumer segments in Vietnam and Indonesia.

Cimigo provides a range of free market research reports on market sectors and consumer segments in Vietnam and Indonesia.