The Road to Saigon
Apr 15, 2025
Watch the Road to Saigon and learn about the stories of the residents. Understand their lives,

Vietnam PMI October 2026: Output growth maintained, but price and supply headwinds
 Admin
 Nov 02, 2026
Cimigo Vietnam market research has collected the Vietnam PMI – manufacturing purchasing managers index since 2013. S&P Global compiles the Vietnam PMI S&P Global from responses to monthly questionnaires sent to purchasing managers in a panel of around 400 manufacturers.
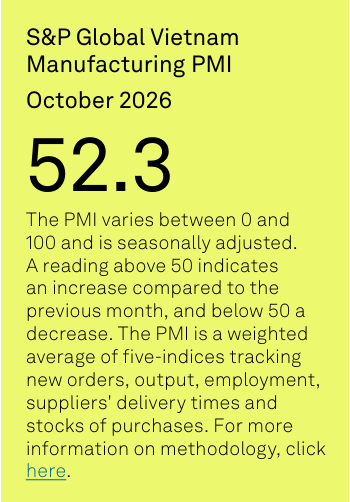
Vietnam PMI October data pointed to continued expansion in the Vietnamese manufacturing sector, although price increases and supply issues limited growth in some cases. Output and new orders rose at slower rates, while employment ticked lower. Higher costs for oil, fuel and transportation contributed to the fastest rise in input prices since June, and suppliers’ delivery times lengthened to a greater extent.
The S&P Global Vietnam Manufacturing Purchasing Managers’ Index™ (PMI®) ticked up to 52.3 in October from 51.9 in September, pointing to a further modest monthly strengthening in the health of the sector at the start of the fourth quarter. Business conditions have now improved in 16 consecutive months.
The extent of the overall improvement in operating conditions was limited, however, by softer rises in output and new orders. Total new business was up for the sixth month running despite an ongoing drag from falling new export orders. The rate of expansion was solid, but the slowest in the current growth sequence.
With new orders increasing amid stronger customer demand, manufacturing production expanded again in October. Nonetheless, here too the pace of growth eased and was at a six-month low. Some respondents indicated that difficulties obtaining raw materials had limited production growth. Transportation difficulties were evident in data on suppliers’ delivery times, which lengthened markedly and to the largest extent since April. Rising fuel prices and poor weather conditions were among the factors leading to transportation delays, according to respondents.
Difficulties importing goods and the use of inputs to support production meant that stocks of purchases decreased solidly, despite sustained growth of input buying as companies made efforts to secure goods in order to support production. Rising transportation costs were also central to the latest rise in input prices as higher costs for oil pushed up fuel prices.
The rate of inflation quickened for the second month running and was the fastest since June, albeit still well below the spike seen following the outbreak of war in the Middle East. In turn, output prices also increased at a sharper pace, following only a slight rise in September.
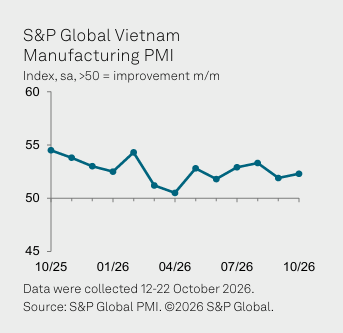
Employment decreased for the third consecutive month in October, falling slightly amid some reports of staff resignations. Despite the drop in workforce numbers, softer new order growth and more efficient processing of outstanding business meant that firms were able to deplete backlogs of work modestly.
Stocks of finished goods also fell as firms used the sale of warehoused goods to draw down inventories. Post-production stocks decreased markedly, albeit to a slightly lesser degree than was the case in September. Hopes for better raw material availability and further improvements in market conditions supported optimism in the 12-month outlook for production. Teh Vietnam PMI sentiment hit an eight month high but was still weaker than prior to the war in the Middle East.
The S&P Global Vietnam Manufacturing PMI® is compiled by S&P Global from responses to monthly questionnaires sent to purchasing managers in a panel of around 400 manufacturers. The panel is stratified by detailed sector and company workforce size, based on contributions to GDP.
Survey responses are collected by Cimigo Vietnam in the second half of each month and indicate the direction of change compared to the previous month. A diffusion index is calculated for each survey variable. The index is the sum of the percentage of ‘higher’ responses and half the percentage of ‘unchanged’ responses.
The indices vary between 0 and 100, with a reading above 50 indicating an overall increase compared to the previous month, and below 50 an overall decrease. The indices are then seasonally adjusted.

The Road to Saigon
Apr 15, 2025
Watch the Road to Saigon and learn about the stories of the residents. Understand their lives,

Indonesia consumer trends 2026
Oct 18, 2026
Indonesia consumer trends 2026 show a tension between steady economic growth and more cautious

Vietnam’s consumer outlook 2027
Oct 14, 2026
Vietnam’s consumer outlook 2027: Why strong economic growth does not guarantee consumer
Đoàn Ngọc Huy (Johnny Doan), CMO & Market Research Expert -
As a Marketing Director and Market Research Expert Advisor across international markets, I have collaborated with numerous market research agencies, both global and local, that operate with a high level of professionalism and effectiveness. Cimigo is among the most outstanding. The Cimigo team demonstrates exceptional professionalism, strong commitment, and operational excellence. From research design and fieldwork execution to insight analysis, all stages are conducted rigorously, delivered on schedule, and closely aligned with business objectives. This is a highly capable team that I would confidently recommend to my partners and stakeholders.
As a Marketing Director and Market Research Expert Advisor across international markets, I have collaborated with numerous market research agencies, both global and local, that operate with a high level of professionalism and effectiveness. Cimigo is among the most outstanding. The Cimigo team demonstrates exceptional professionalism, strong commitment, and operational excellence. From research design and fieldwork execution to insight analysis, all stages are conducted rigorously, delivered on schedule, and closely aligned with business objectives. This is a highly capable team that I would confidently recommend to my partners and stakeholders.

Lisa Nguyen - Vietnam Marketing Lead

Mark Ratcliff - Managing Director
The team at Cimigo are my favourite researchers in South East Asia. They’ve proved adept at tackling the most private and complex personal issues at qualitative research level, not flinching when the client endlessly chopped and changed fieldwork timing, or ramped up the workload without warning. They have recruited the most extraordinarily niche consumers without pause or complaint. Their patience with clients and their flexibility and hard work that went above and beyond what was initially asked of them on two projects relating to sexual behaviour means there is now no other research company we would choose to work with in that part of Asia. The fact they also pulled off a third project for us so well, on men’s relationship with beer and beer advertising, shows they have breadth of expertise— we still quote from the report they produced.
The team at Cimigo are my favourite researchers in South East Asia. They’ve proved adept at tackling the most private and complex personal issues at qualitative research level, not flinching when the client endlessly chopped and changed fieldwork timing, or ramped up the workload without warning. They have recruited the most extraordinarily niche consumers without pause or complaint. Their patience with clients and their flexibility and hard work that went above and beyond what was initially asked of them on two projects relating to sexual behaviour means there is now no other research company we would choose to work with in that part of Asia. The fact they also pulled off a third project for us so well, on men’s relationship with beer and beer advertising, shows they have breadth of expertise— we still quote from the report they produced.

Kevin McQuillan - Chief Marketing Officer

Sam Houston - Chief Executive Officer

Minh Thu - Consumer Market Insights Manager
Travis Mitchell - Executive Director
Malcolm Farmer - Managing Director

Hy Vu - Head of Research Department

Joe Nelson - New Zealand Consulate General

Steve Kretschmer - Executive Director
York Spencer - Global Marketing Director

Laura Baines - Programmes Snr Manager

Mai Trang - Brand Manager of Romano

Hanh Dang - Product Marketing Manager
Luan Nguyen - Market Research Team Leader
Max Lee - Project Manager

Chris Elkin - Founder

Ronald Reagan - Deputy Group Head After Sales & CS Operation
Chad Ovel - Partner

Private English Language Schools - Chief Executive Officer

Rick Reid - Creative Director

Anya Nipper - Project Coordination Director

Dr. Jean-Marcel Guillon - Chief Executive Officer
Joyce - Pricing Manager

Matt Thwaites - Commercial Director
Aashish Kapoor - Head of Marketing

Kelly Vo - Founder & Host
Thanyachat Auttanukune - Board of Management
Hamish Glendinning - Business Lead

Thuy Le - Consumer Insight Manager
Richard Willis - Director

Ha Dinh - Project Lead
Geert Heestermans - Marketing Director

Vo Thi Thuy Ha - Commercial Effectiveness

Louise Knox - Consumer Technical Insights

Aimee Shear - Senior Research Executive

Dennis Kurnia - Head of Consumer Insights
Tania Desela - Senior Product Manager
Thu Phung - CTI Manager
Linda Yeoh - CMI Manager

 Team
Cimigo’s market research team in Vietnam and Indonesia love to help you make better choices.
 Solutions
Cimigo provides market research solutions in Vietnam and Indonesia that will help you make better choices.
 Trends
Cimigo provides a range of consumer marketing trends and market research on market sectors and consumer segments in Vietnam and Indonesia.
 Reports
Cimigo provides a range of free market research reports on market sectors and consumer segments in Vietnam and Indonesia.