FIFA World Cup 2026: Public enthusiasm and brand opportunities through special edition products
Jul 17, 2026
By Mohammad Diego Ar-Rasyid A tournament that divides opinion The FIFA World Cup 2026 Final is
Vietnam economic class and rising affluence
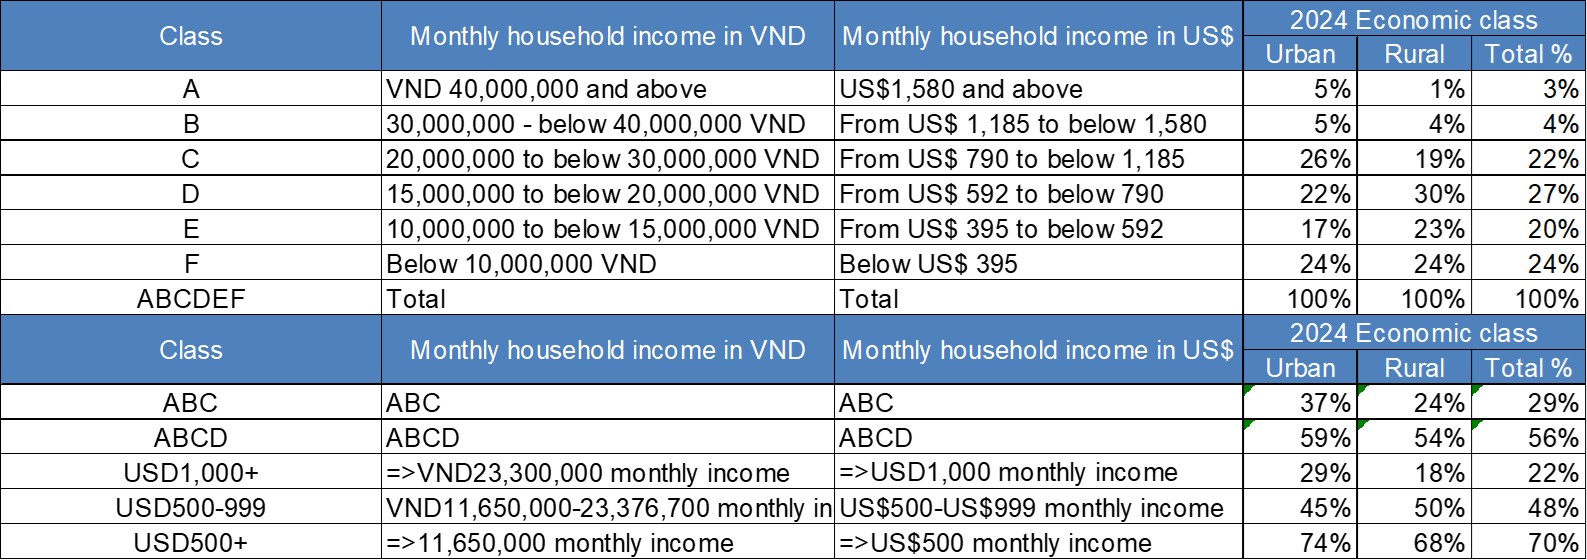
Vietnam economic class structure continues to change dramatically. Middle-class acceleration coupled with urban migration and lower birth rates means that households are smaller and wealthier. In 2024 there were 15.8 million households have an income above US$ 592 (VND 15,000,000) per month. These households are classified as ABCD economic class. 56% of households in 2024 are ABCD class. This equates to 56.2 million people.
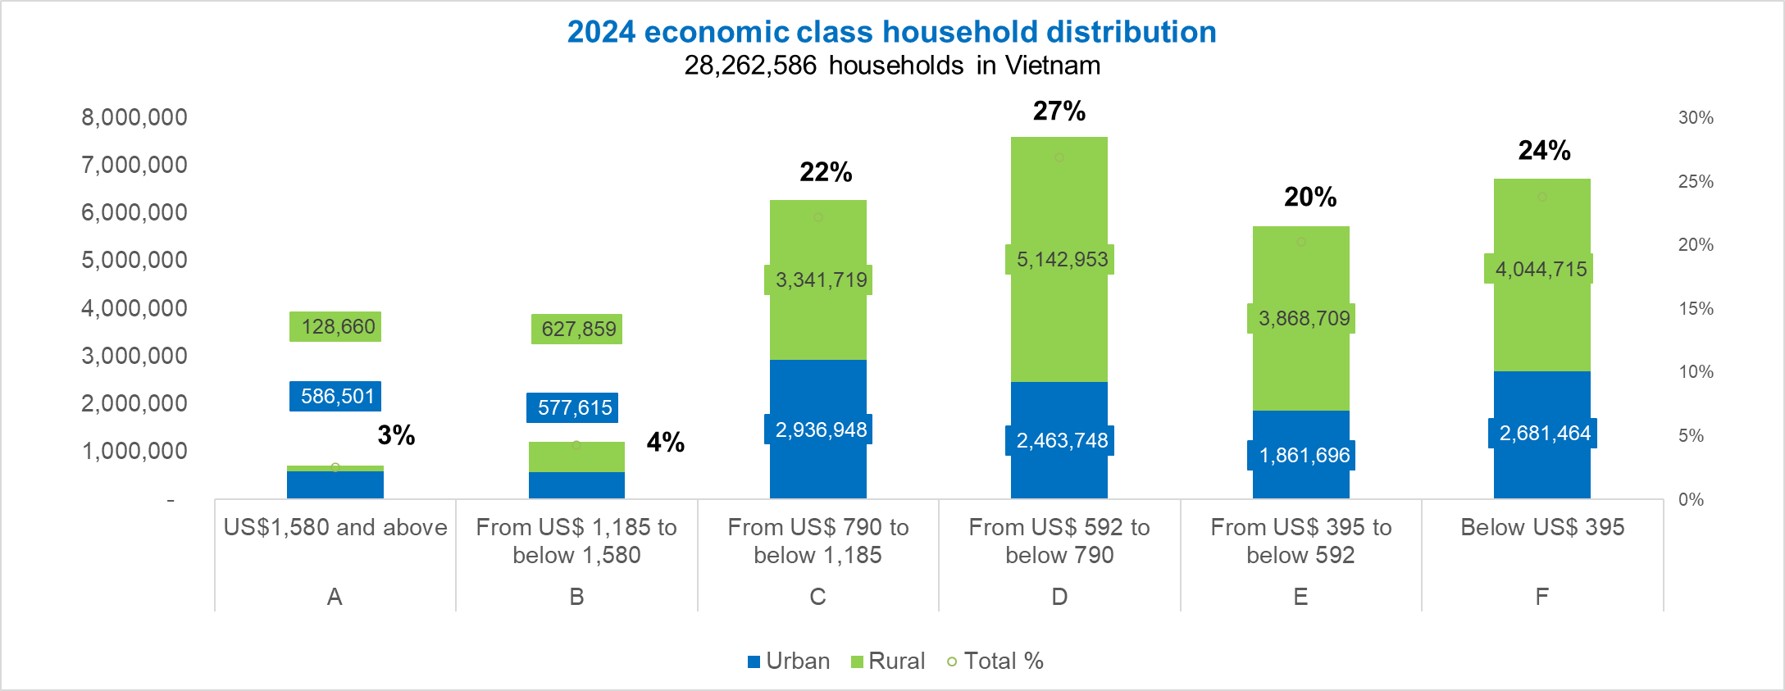
Economic class is provided by grades ABCDEF and is based on claimed monthly household income. Data is taken from over 145,000 Cimigo household sample surveys.
Year 2024: US$1 = VND25,322
Economic class is provided by grades ABCDEF and is based on claimed monthly household income. Data is taken from over 145,000 Cimigo household sample surveys.
Year 2024: US$1 = VND25,322
The figures below demonstrate affluence in 20024. Variance over 2023 are shown, there was a small incremental change over 2023.
Get instant access to syndicated consumer insights, market trends, and competitive intelligence across Vietnam.
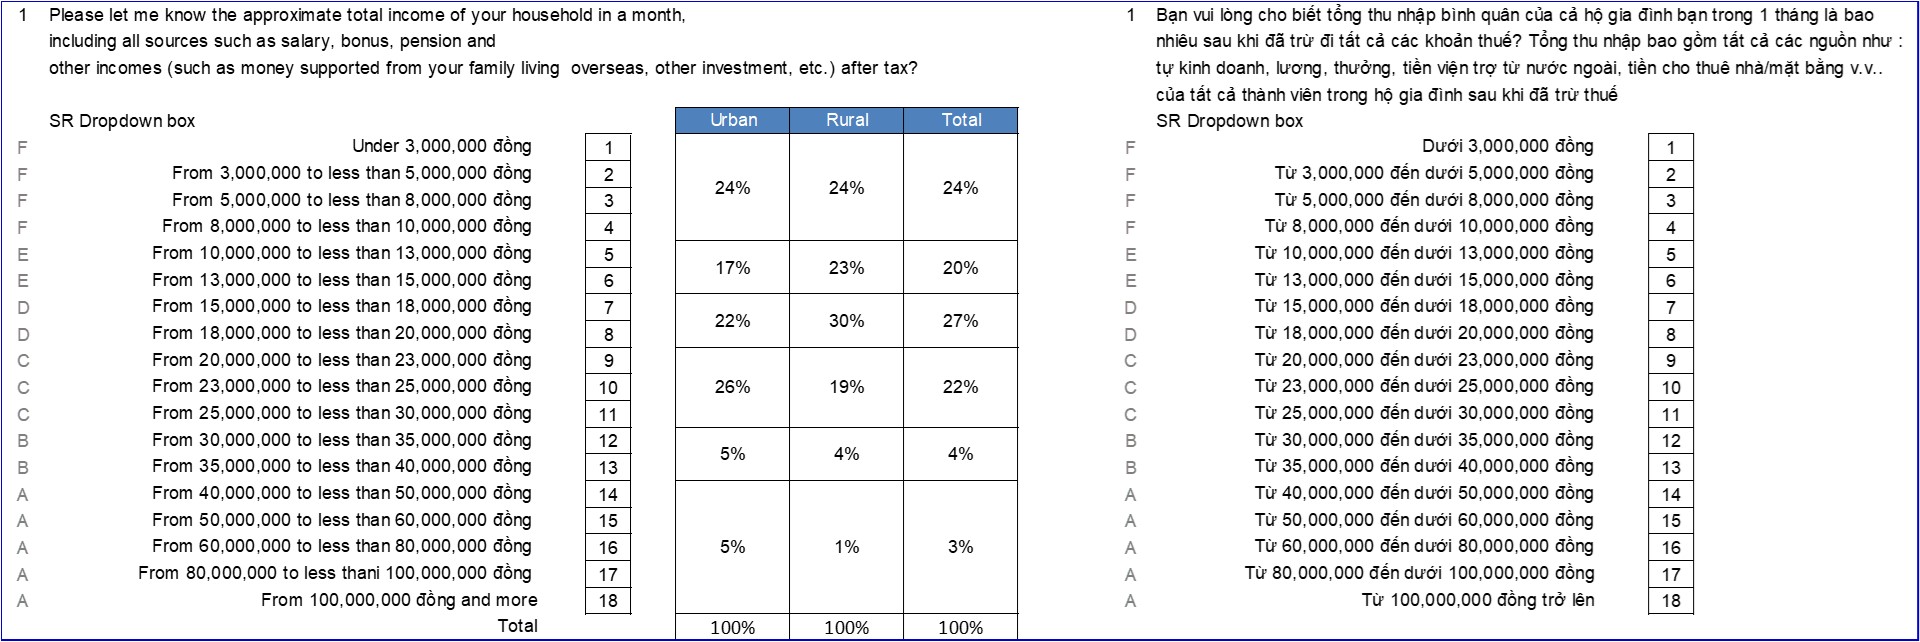
This question establishes the claimed monthly household income.
There are key weaknesses to using this approach. The survey participant may under or over the claim, may not wish to share or may not accurately know. The latter can be particularly true when interviewing younger adults in households. Survey methods do their best to reduce these errors (participant reads a code not the amount, confidentiality is reassured), but certainly, some errors persist. This is one reason why surveys have large samples, so the few errors do not bias the overall results.
The key advantages are speed, simplicity and adaptability across all interview methods.
The question used by Cimigo is provided below.
Please let me know the approximate total income of your household in a month, including all sources such as salary, bonus, pension and other incomes (such as money support from your family living overseas, other investment, etc.) after tax?
Bạn vui lòng cho biết tổng thu nhập bình quân của cả hộ gia đình bạn trong 1 tháng là bao nhiêu sau khi đã trừ đi tất cả các khoản thuế? Tổng thu nhập bao gồm tất cả các nguồn như : tự kinh doanh, lương, thưởng, tiền viện trợ từ nước ngoài, tiền cho thuê nhà/mặt bằng v.v..của tất cả thành viên trong hộ gia đình sau khi đã trừ thuế?
A household is an economic unit in which there are typically earners and dependents. There is typically a household category manager who looks after the “market” money to buy groceries and pay bills each week. The economic unit must allocate its income across necessities (housing, health, education, staple food, etc.) and discretionary expenditure (entertainment, indulgencies, extra learning, holidays, fashion and beauty, etc.).
Economic class classifications help simply understand the multitude of households, by classifying “like” households based on affluence into different economic class cohorts. Marketing teams need to build their brands and sell their goods and services to these economic units. For this reason, market research teams need to understand their behaviour and assess their needs and preferences.
There is a dearth of reliable secondary sources on household economic status. Sources such as the General Statistics Office of Vietnam provide average personal income data in the household living standard surveys. However, the data on distributions is limited and does not exist for household income.
Marketing, brand, media and research professionals use economic class classifications to both describe and target different cohorts of consumers based on their economic class or affluence. Economic class is a proxy to understand lifestyles, media use, discretionary expenditure, behaviour, shopping channels, use of premium or regular ‘mainstream’ brands and preferences.
In many studies, random household sampling is used to select households. This simply means each household should have the same chance (probability) of being selected for an interview. In such cases, no quotas are used to ensure the sample represents the household economic class distribution. Random household sampling allows natural and equal probability when selecting households.
Quotas may be used to ensure fair representation of other parameters such as the participant’s gender or age.
Random household surveys are expensive and hence many studies do not use random household sampling but use purposive sampling with quotas. In such cases, Cimgio will deploy quota sampling for the area, household economic class, gender, age and other relevant factors to any study being undertaken. Quotas are set in proportion to the population with a defined target group so that each group is fairly represented. For example males and females, young and old, economic class AB, CD and EF.
For example Study A needs to survey low-income rural households Cimigo will select economic class F households earning less than 10 million Vietnam dong per month (approximately US$395), which represents 46% of households in rural areas. In contrast Study B is focused on wealthy urban households who can afford a new electric motorbike, Cimigo may select only economic class ABC households earning over 20 million Vietnam dong per month (approximately US$790), this represents 37% of households in urban areas.
Measuring the economic class in Vietnam was greatly simplified in 2014. Between 1997 and 2014 economic class was calculated based on points allocated to household durables, housing type and the number of people in each household. It was cumbersome to ask and required interviewers to manually calculate (this was in a time when surveys used pen and paper, not digital tablets) and required observation at the home to fairly assess the housing type.
In 2015 this was adjusted to purely measure claimed monthly household income. The reason for this change was to simplify the process and make the process quicker and adaptable across different interview methodologies including face-to-face, telephone and online interviewing.
At varying intervals between 3 and 5 years the monthly household income breaks for the economic class are updated to reflect rising affluence in society.
Economic class is used in Vietnam, not social-economic class as most countries use. In many other countries, the classification of the social-economic class is used. The social element typically looks at social status using both the educational attainment and occupation seniority attained by the head of the household. This is typically a working father or mother. This is cross-referenced with monthly household income in a matrix to classify household social-economic class.
This system fails in Vietnam, owing to the rapid economic development in Vietnam since 1980. Today and for the last forty-four years, a young adult male or female will often be earning more than the head of the household. They are often (not always) better educated, are more worldly aware and have been given better opportunities than their parents (largely thanks to the sacrifices their parents have made for them).
Hence in Vietnam, the classification relies solely on economic status and not social status through education and occupation.
Get instant access to syndicated consumer insights, market trends, and competitive intelligence across Vietnam.
If you have any questions or specific needs, please get in touch with us at ask@cimigo.com.

FIFA World Cup 2026: Public enthusiasm and brand opportunities through special edition products
Jul 17, 2026
By Mohammad Diego Ar-Rasyid A tournament that divides opinion The FIFA World Cup 2026 Final is

The Road to Saigon
Apr 15, 2025
Watch the Road to Saigon and learn about the stories of the residents. Understand their lives,

Vietnam uninterrupted: a twenty-year journey
Mar 18, 2024
Trends in Vietnam: Vietnam uninterrupted: a twenty-year journey Trends in Vietnam. Witness

Đoàn Ngọc Huy (Johnny Doan), CMO & Market Research Expert -
As a Marketing Director and Market Research Expert Advisor across international markets, I have collaborated with numerous market research agencies, both global and local, that operate with a high level of professionalism and effectiveness. Cimigo is among the most outstanding. The Cimigo team demonstrates exceptional professionalism, strong commitment, and operational excellence. From research design and fieldwork execution to insight analysis, all stages are conducted rigorously, delivered on schedule, and closely aligned with business objectives. This is a highly capable team that I would confidently recommend to my partners and stakeholders.
As a Marketing Director and Market Research Expert Advisor across international markets, I have collaborated with numerous market research agencies, both global and local, that operate with a high level of professionalism and effectiveness. Cimigo is among the most outstanding. The Cimigo team demonstrates exceptional professionalism, strong commitment, and operational excellence. From research design and fieldwork execution to insight analysis, all stages are conducted rigorously, delivered on schedule, and closely aligned with business objectives. This is a highly capable team that I would confidently recommend to my partners and stakeholders.

Lisa Nguyen - Vietnam Marketing Lead

Mark Ratcliff - Managing Director
The team at Cimigo are my favourite researchers in South East Asia. They’ve proved adept at tackling the most private and complex personal issues at qualitative research level, not flinching when the client endlessly chopped and changed fieldwork timing, or ramped up the workload without warning. They have recruited the most extraordinarily niche consumers without pause or complaint. Their patience with clients and their flexibility and hard work that went above and beyond what was initially asked of them on two projects relating to sexual behaviour means there is now no other research company we would choose to work with in that part of Asia. The fact they also pulled off a third project for us so well, on men’s relationship with beer and beer advertising, shows they have breadth of expertise— we still quote from the report they produced.
The team at Cimigo are my favourite researchers in South East Asia. They’ve proved adept at tackling the most private and complex personal issues at qualitative research level, not flinching when the client endlessly chopped and changed fieldwork timing, or ramped up the workload without warning. They have recruited the most extraordinarily niche consumers without pause or complaint. Their patience with clients and their flexibility and hard work that went above and beyond what was initially asked of them on two projects relating to sexual behaviour means there is now no other research company we would choose to work with in that part of Asia. The fact they also pulled off a third project for us so well, on men’s relationship with beer and beer advertising, shows they have breadth of expertise— we still quote from the report they produced.
Kevin McQuillan - Chief Marketing Officer

Sam Houston - Chief Executive Officer

Minh Thu - Consumer Market Insights Manager

Travis Mitchell - Executive Director

Malcolm Farmer - Managing Director
Hy Vu - Head of Research Department

Joe Nelson - New Zealand Consulate General

Steve Kretschmer - Executive Director
York Spencer - Global Marketing Director

Laura Baines - Programmes Snr Manager

Mai Trang - Brand Manager of Romano

Hanh Dang - Product Marketing Manager

Luan Nguyen - Market Research Team Leader
Max Lee - Project Manager

Chris Elkin - Founder

Ronald Reagan - Deputy Group Head After Sales & CS Operation
Chad Ovel - Partner

Private English Language Schools - Chief Executive Officer

Rick Reid - Creative Director

Anya Nipper - Project Coordination Director

Dr. Jean-Marcel Guillon - Chief Executive Officer

Joyce - Pricing Manager

Matt Thwaites - Commercial Director

Aashish Kapoor - Head of Marketing

Kelly Vo - Founder & Host

Thanyachat Auttanukune - Board of Management
Hamish Glendinning - Business Lead

Thuy Le - Consumer Insight Manager
Richard Willis - Director

Ha Dinh - Project Lead
Geert Heestermans - Marketing Director

Vo Thi Thuy Ha - Commercial Effectiveness

Louise Knox - Consumer Technical Insights

Aimee Shear - Senior Research Executive

Dennis Kurnia - Head of Consumer Insights

Tania Desela - Senior Product Manager
Thu Phung - CTI Manager

Linda Yeoh - CMI Manager

Cimigo’s market research team in Vietnam and Indonesia love to help you make better choices.

Cimigo provides market research solutions in Vietnam and Indonesia that will help you make better choices.

Cimigo provides a range of consumer marketing trends and market research on market sectors and consumer segments in Vietnam and Indonesia.

Cimigo provides a range of free market research reports on market sectors and consumer segments in Vietnam and Indonesia.